Point Cloud and Panorama Display Options

This section describes how to control and refine the visual appearance of point clouds, including selecting appropriate rendering modes for different use cases. It explains how modes such as RGB, Normal, X-ray, and Cloud-based rendering support various visualization needs. Additionally, it covers how to find and open the right panoramic images based on there locations to enhance data interpretation.

Point Cloud Color Modes

Point Cloud Color Selector

To switch between the different types of point cloud rendering you can use the Color Mode Selector inside the Qbitec ribbon:
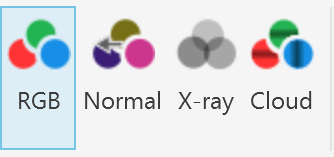
image.png

There you can choose between RGB, Normal, X-ray and Cloud based rendering.


RGB

RGB colorization assigns each LiDAR point a color derived from camera imagery or another optical sensor. The colors represent the visual appearance of the scene, not only its geometry. This provides several advantages.

RGB values contain information about material and appearance. This makes it easier to distinguish objects that may have similar geometry but different visual properties (e.g., road vs. grass, building facade vs. window).

RGB-colored point clouds look similar to the real scene. This improves interpretability for humans.

 If color is not available this mode tries to fall back to an intensity based shading of the point cloud.
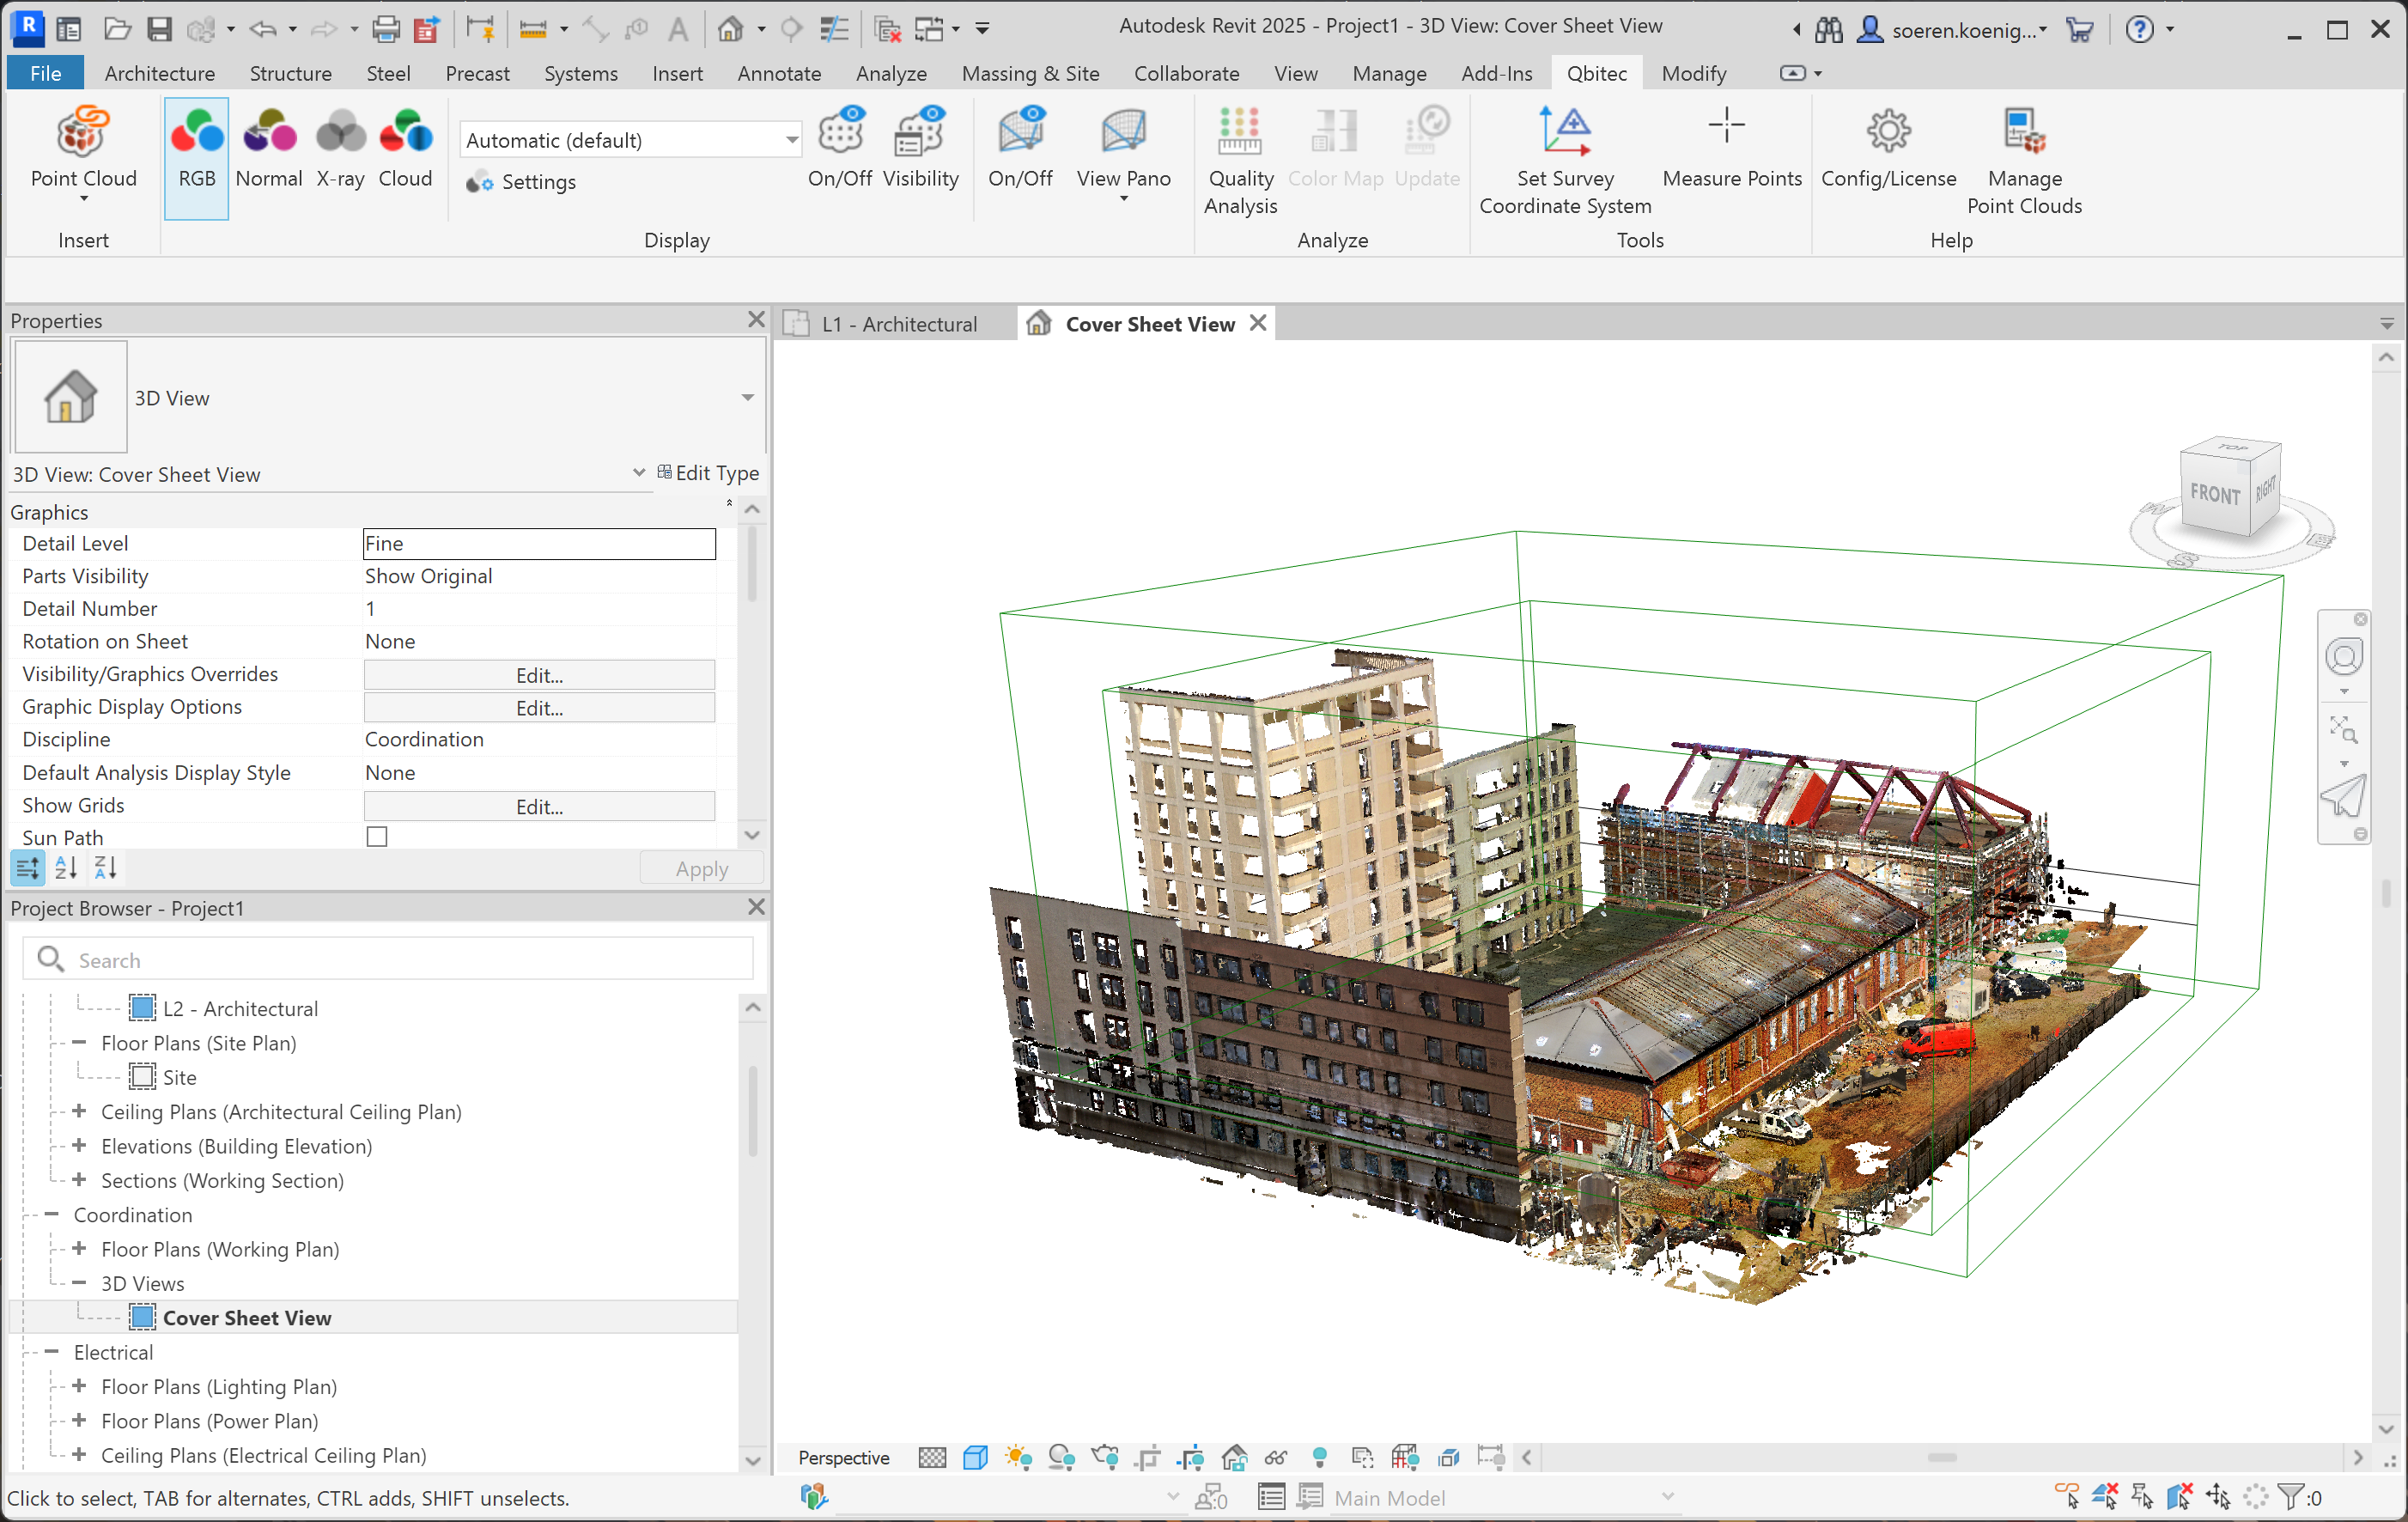
image.png

Normal

Normal-based colorization assigns colors to points according to the surface normal vector estimated at each point.
Coloring by normals highlights changes in surface orientation. Edges, corners, ridges, and planar regions become visually distinct, making the geometric structure of the point cloud easier to interpret.
Unlike RGB colorization from images, normal-based coloring depends only on geometry. It therefore works reliably in scenes where texture, lighting, or camera alignment is poor or unavailable.
In structured environments (urban scenes, buildings, indoor scans), surfaces like floors, walls, and ceilings typically have consistent normals. Coloring by normals quickly reveals these dominant planes.
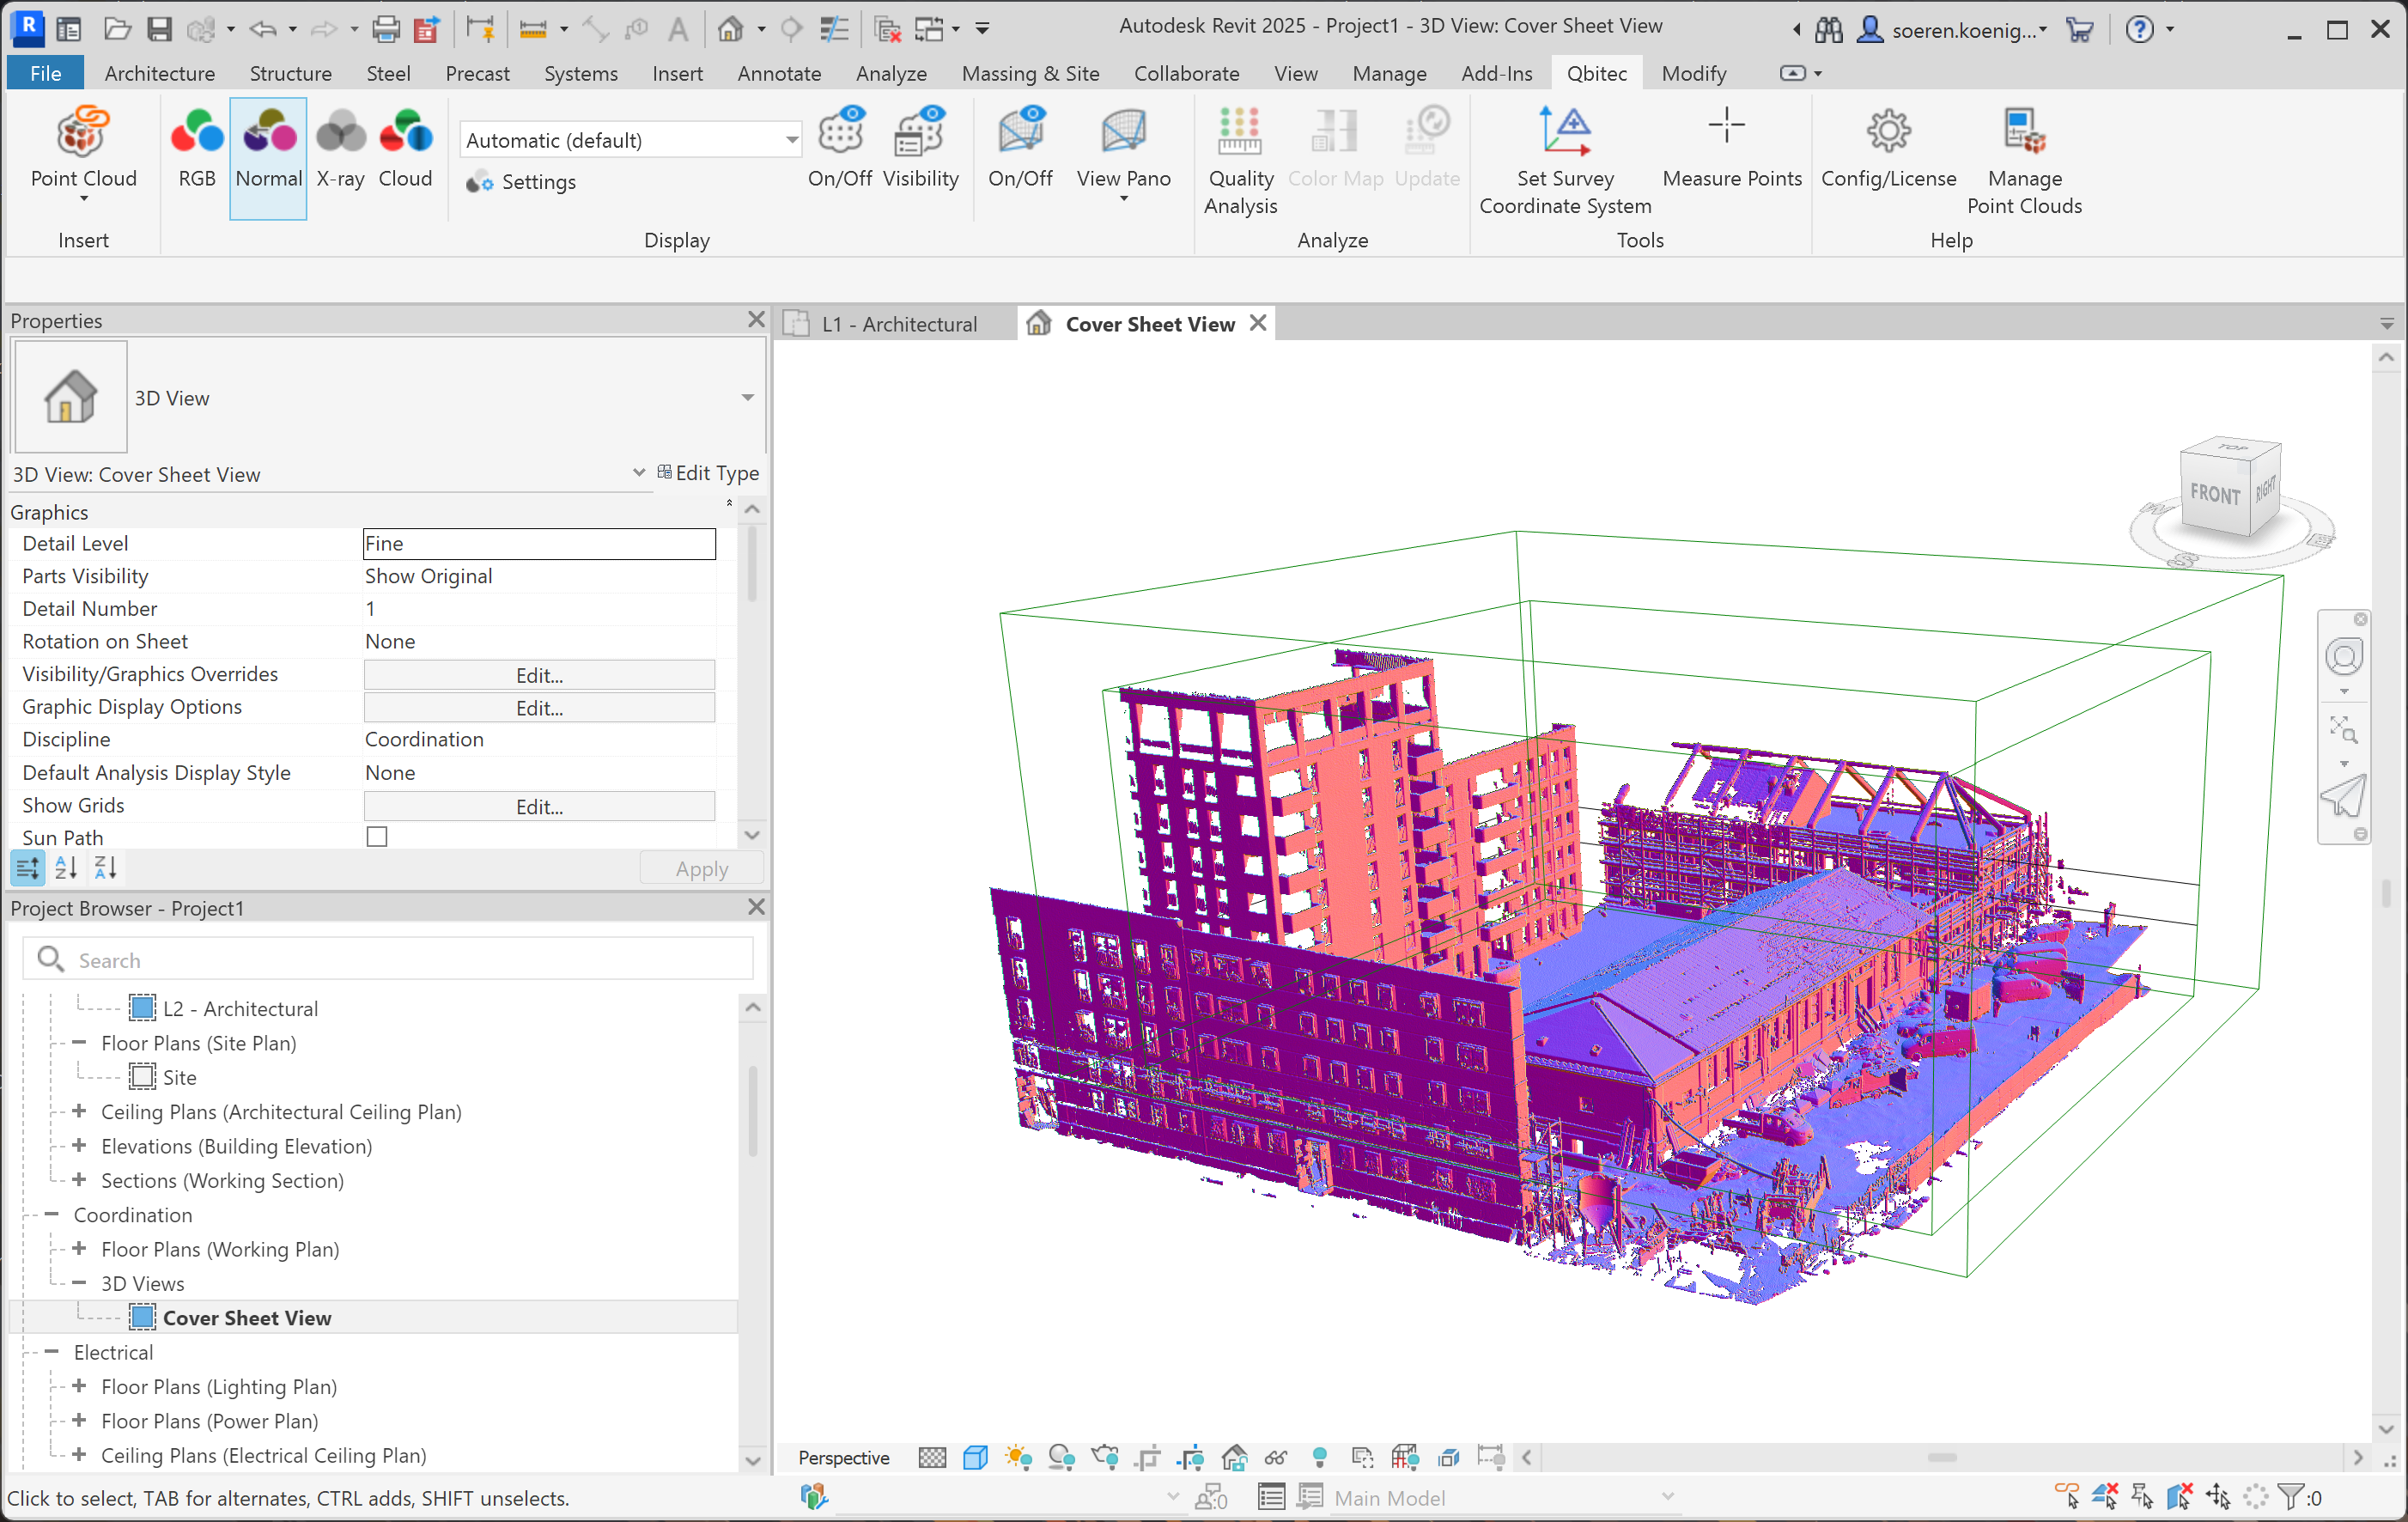
image.png

X-Ray

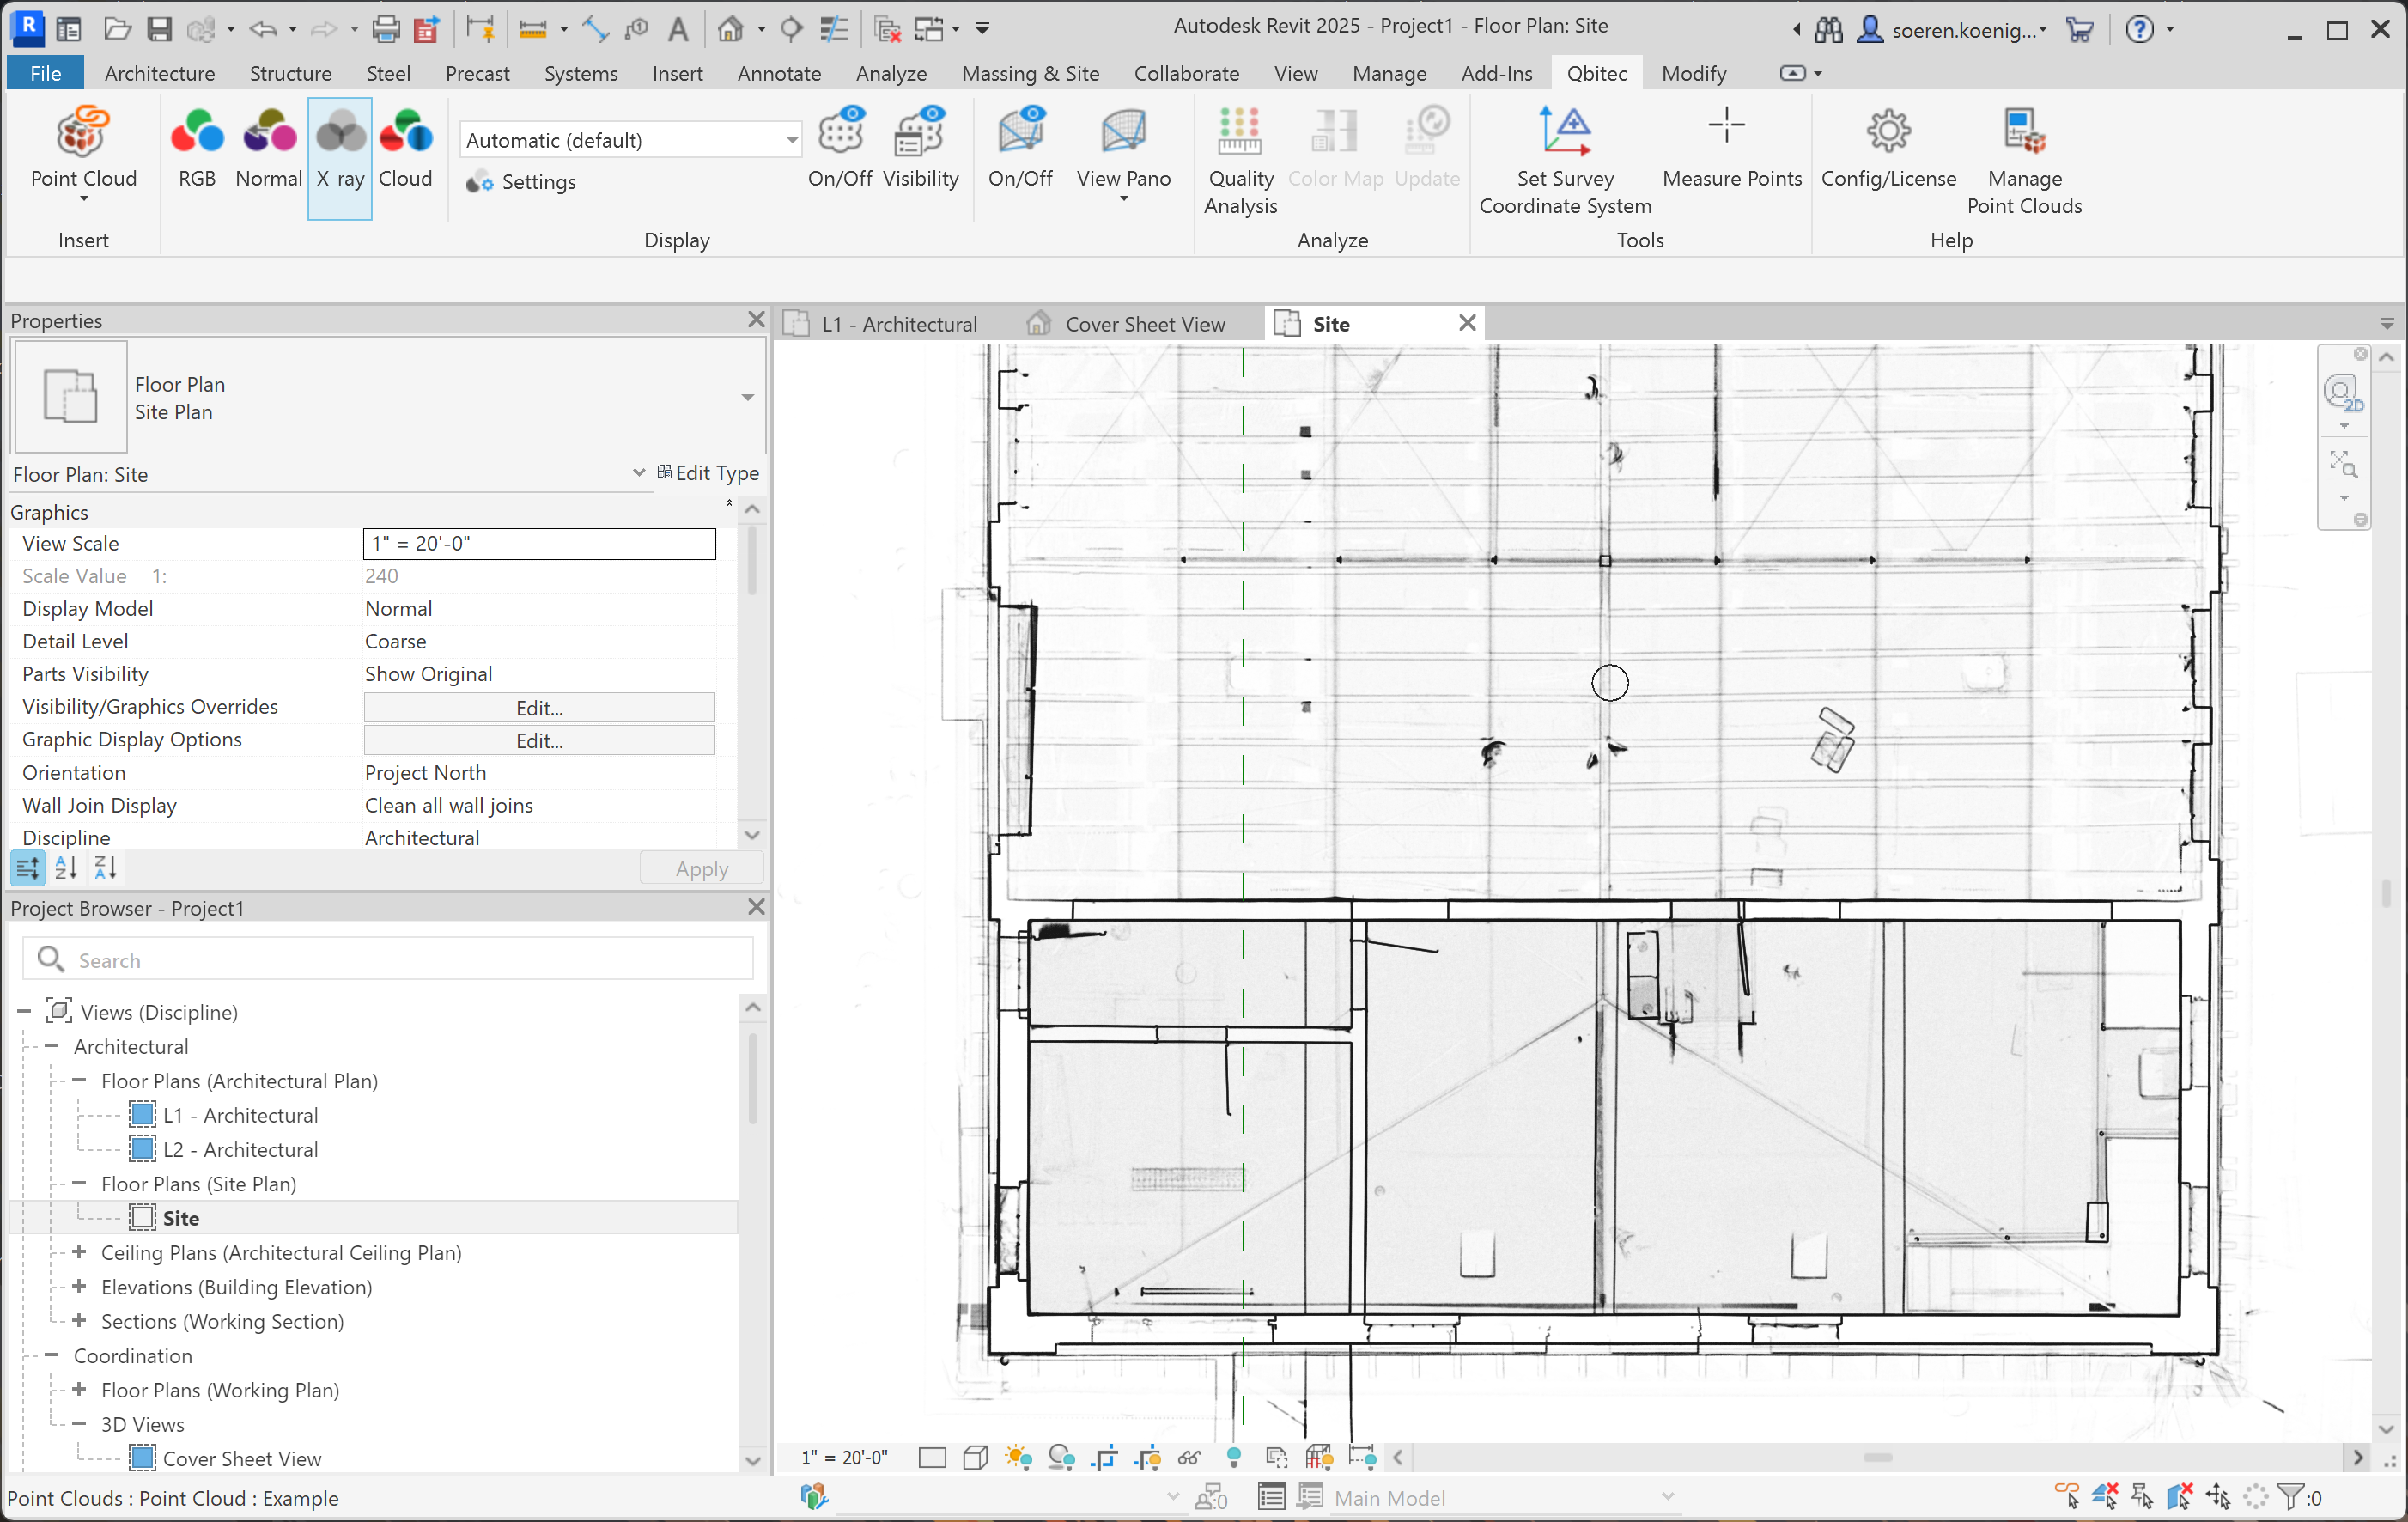
The X-ray rendering mode is particularly useful in orthographic projections like top or side views, because it reveals structural elements like floors, walls, door openings, windows, corridors or stairwells of buildings in a way that resembles a floor plan.
It also helps to locate panorama image symbols more easily, since the X-ray rendering prevents them from being hidden behind walls or other geometry, keeping them visible in the orthographic view.

image.png
Cloud

In the cloud-based color mode, each individual point cloud (e.g., each scan or dataset) is displayed in a distinct, user-configurable color. The color represents the source point cloud the points belong to.
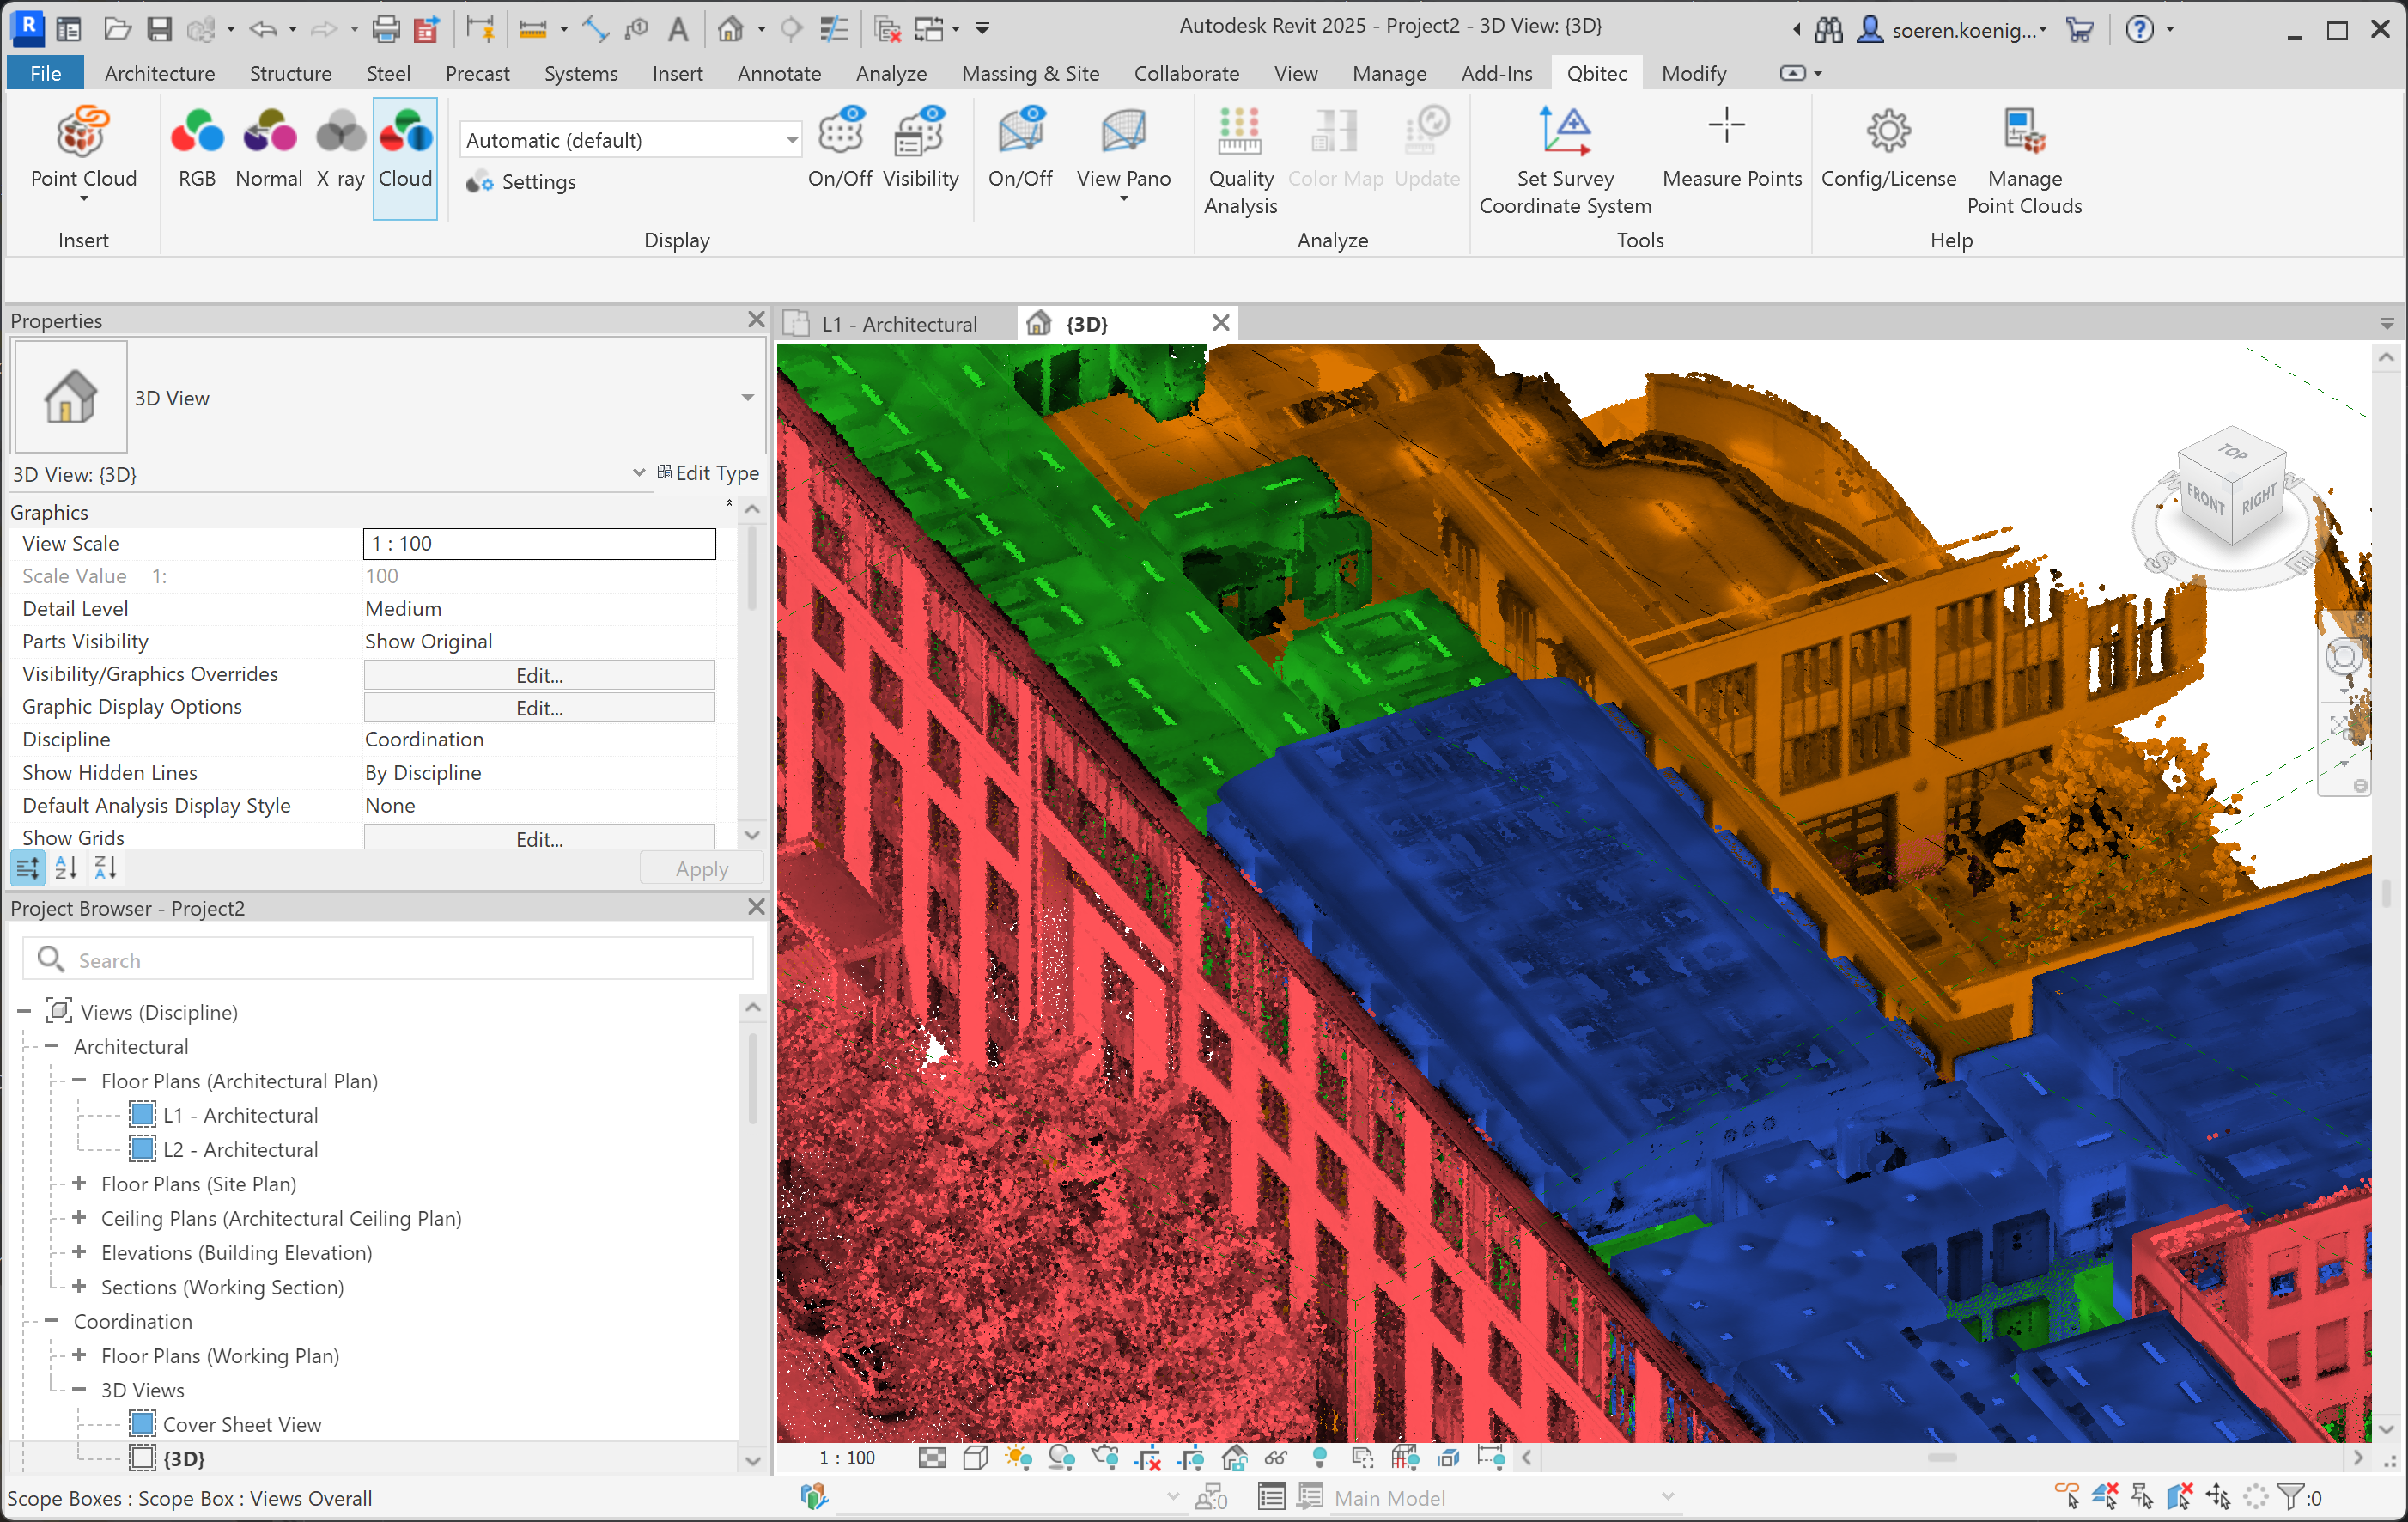
image.png

Point Cloud Display Settings

Settings are stored per view

Adjusting the Point Size

The point size used for rendering the point cloud can be adjusted. Three predefined options are available: Automatic, Medium, and Fine.
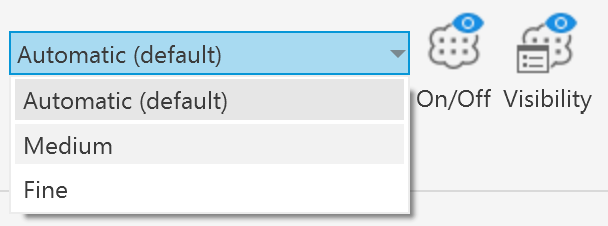
image.png

Fine

The Fine setting uses a small point size similar to the point cloud rendering used to display ReCap point clouds in Revit. This can often create the effect that the point cloud becomes visually sparse, allowing the viewer to see through it so that surfaces become difficult to recognize.
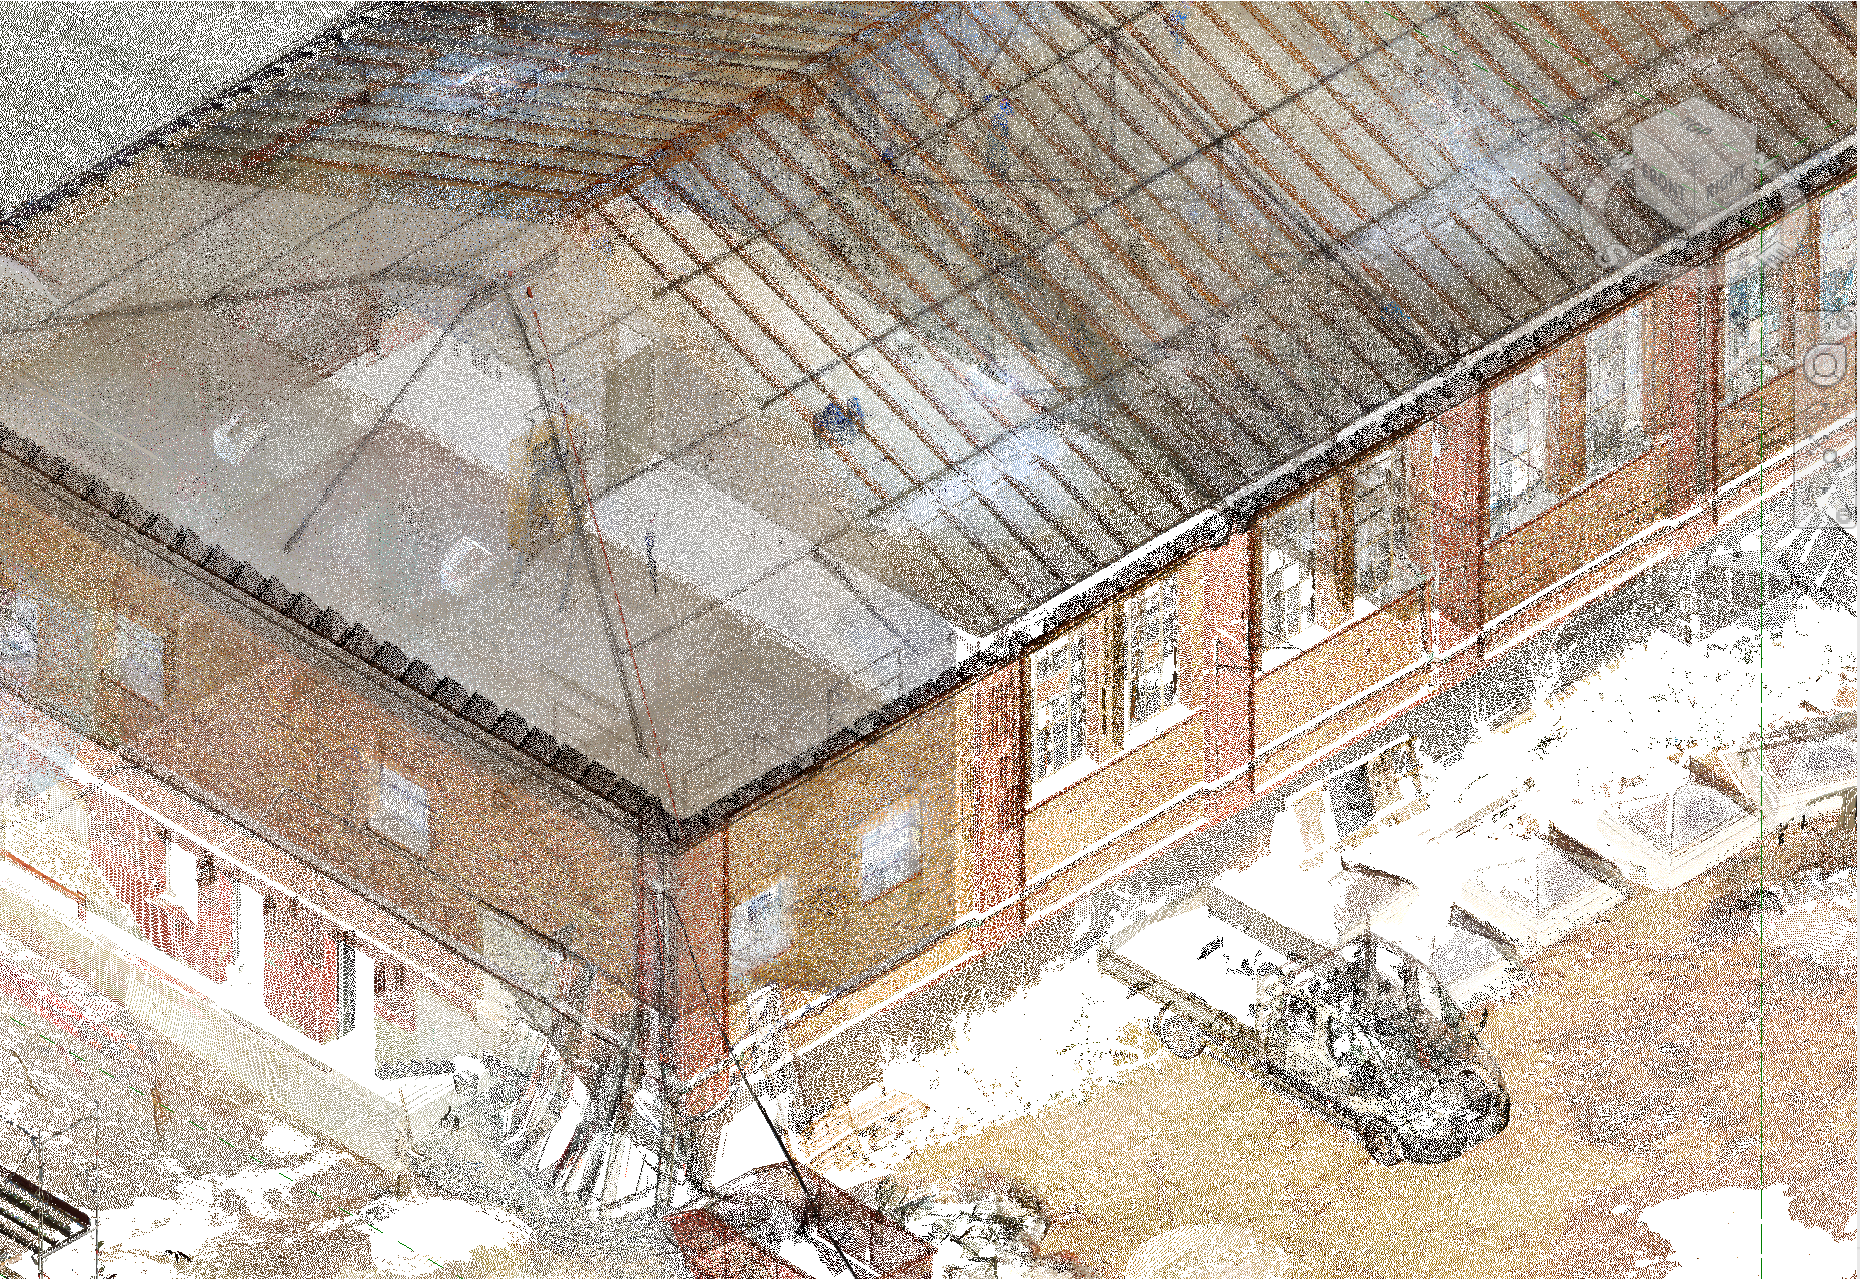
image.png

Automatic (default)

The Automatic setting attempts to choose a point size that keeps surfaces such as walls visually closed and easier to interpret, while Medium provides a compromise between the two extremes. 
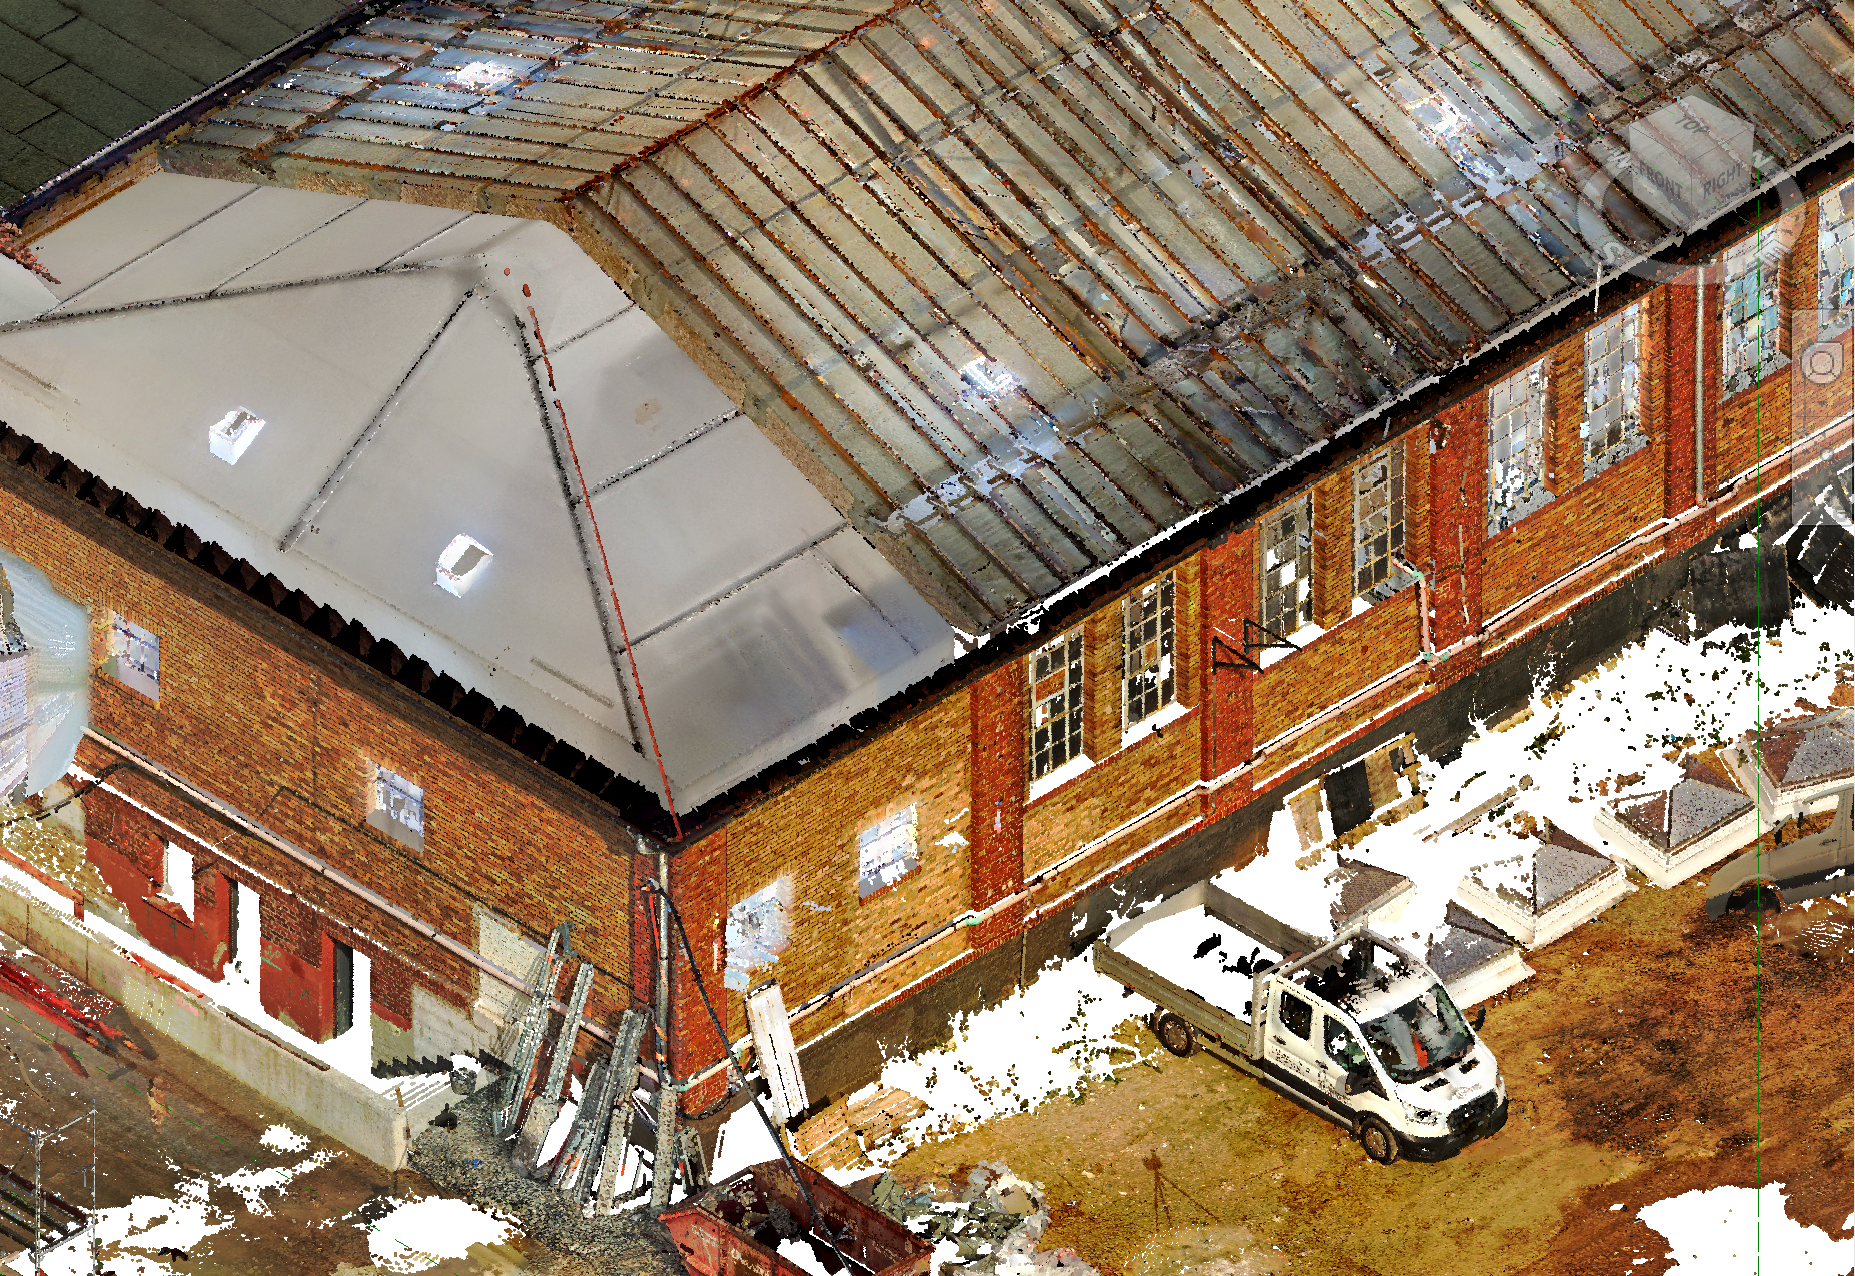
image.png

For additional control, the point size can also be manually adjusted.

Therefore open the display settings by clicking on the Settings-button

image.png

And adjust the Point size using the point size slider.

image.png

In the Setting Window you can also find a few other settings to control the visual appearance of point clouds. 

Brightness and Contrast Slider

LiDAR scans are sometimes captured under poor lighting conditions, such as in the evening or in dimly lit indoor environments. In these cases, adjusting the brightness and contrast can help enhance visibility and reveal more details in the data.

image.pngimage.png


Transparency

The transparency of the point cloud can also be adjusted using a slider, allowing internal geometry to become visible that would otherwise be hidden behind the outer layers of the point cloud.

image.pngimage.png

X-Ray Contrast

When working in an orthographic X-ray view, it can also be useful to adjust the X-ray contrast. Changing this setting alters how strongly different depth layers are emphasized, which can make certain structures more visible.

Lower contrast can help highlight larger structural elements such as walls and windows, while higher contrast can reveal finer details like beams, structural supports, or stair steps.

image.pngimage.png

Since certain Revit geometry such as walls may also appear in monochrome white and black, it can sometimes be difficult to distinguish them from the contour lines produced by the X-ray visualization. For this reason, the color used for the X-ray mode can be adjusted with the following button:

image.png

In this example the X-ray color was adjusted to red make the two make the already modeled exterior wall better visible:

image.png

Additionally, it is also possible to display each point cloud in the X-ray view with its own individual color, which can further improve visual separation and make structures easier to interpret.

Finally, to go back to the default settings click on the Reset to default button. 

Visibility of All Point Clouds

With the On/Off-button depicted in this screenshot, it is possible to toggle the visibility of all point clouds in the current view at once.

image.png

Visibility of Individual Point Clouds

The hide and show individual point clouds first click on the Visibility-button.

image.png

This opens a list of all point clouds in the scene. When a specific point cloud is selected it is highlighted by its associated color while non selected point clouds are displayed with its normal RGB colors.  

image.png

To hide or show single point clouds you can use the blue eye symbol button behind each cloud in the list. In the example The blue, pink and green point clouds are hidden and only the orange one is shown.

image.png

If you are not satisfied with the automatically assigned colors, you can change them by clicking on the colored rectangle in front of the point cloud name.

image.png

Displaying Panoramic Images

Opening and Navigating inside Panoramic Views

Show/Hide Panoramic Image Symbols

If the panoramas are not required, or if the displayed panorama spheres interfere with the modeling process—for example by obscuring important details—they can be hidden in the respective 3D view.

To do so, click the Panorama On/Off button to toggle the visibility of the panorama symbols.

image.png

Creating a Panoramic View Template

Often, users want to configure personalized view settings for panoramic views. To avoid repeating this process for each newly opened panorama, a template can be created to automatically apply these settings.

The Create Pano View Template command saves the settings of the currently active panoramic view into a Revit view template named QbitecPanoViewTemplate. This template is automatically applied to newly created panoramic views.

image.png

What it does

The settings are applied without forcing the view to stay bound to the template. This means the pano view remains fully editable and view-specific adjustments can still be made at any time.

Behavior when a template already exists:

If a view template named QbitecPanoViewTemplate already exists, it will be overwritten when the command is executed.