
Quick Start Guide
This quick start guide walks you step by step through the quality analysis process, allowing you to quickly check your model against the point cloud using flatness and deviation analysis, tolerance checks, clash detection, and completeness checks - so you can identify issues early and ensure your data meets the required standards.
The following picture shows a small sample model taken from a larger hospitality project. The point cloud is colored in "Cloud" mode for better visibility, and the veranda at the front has not yet been modeled: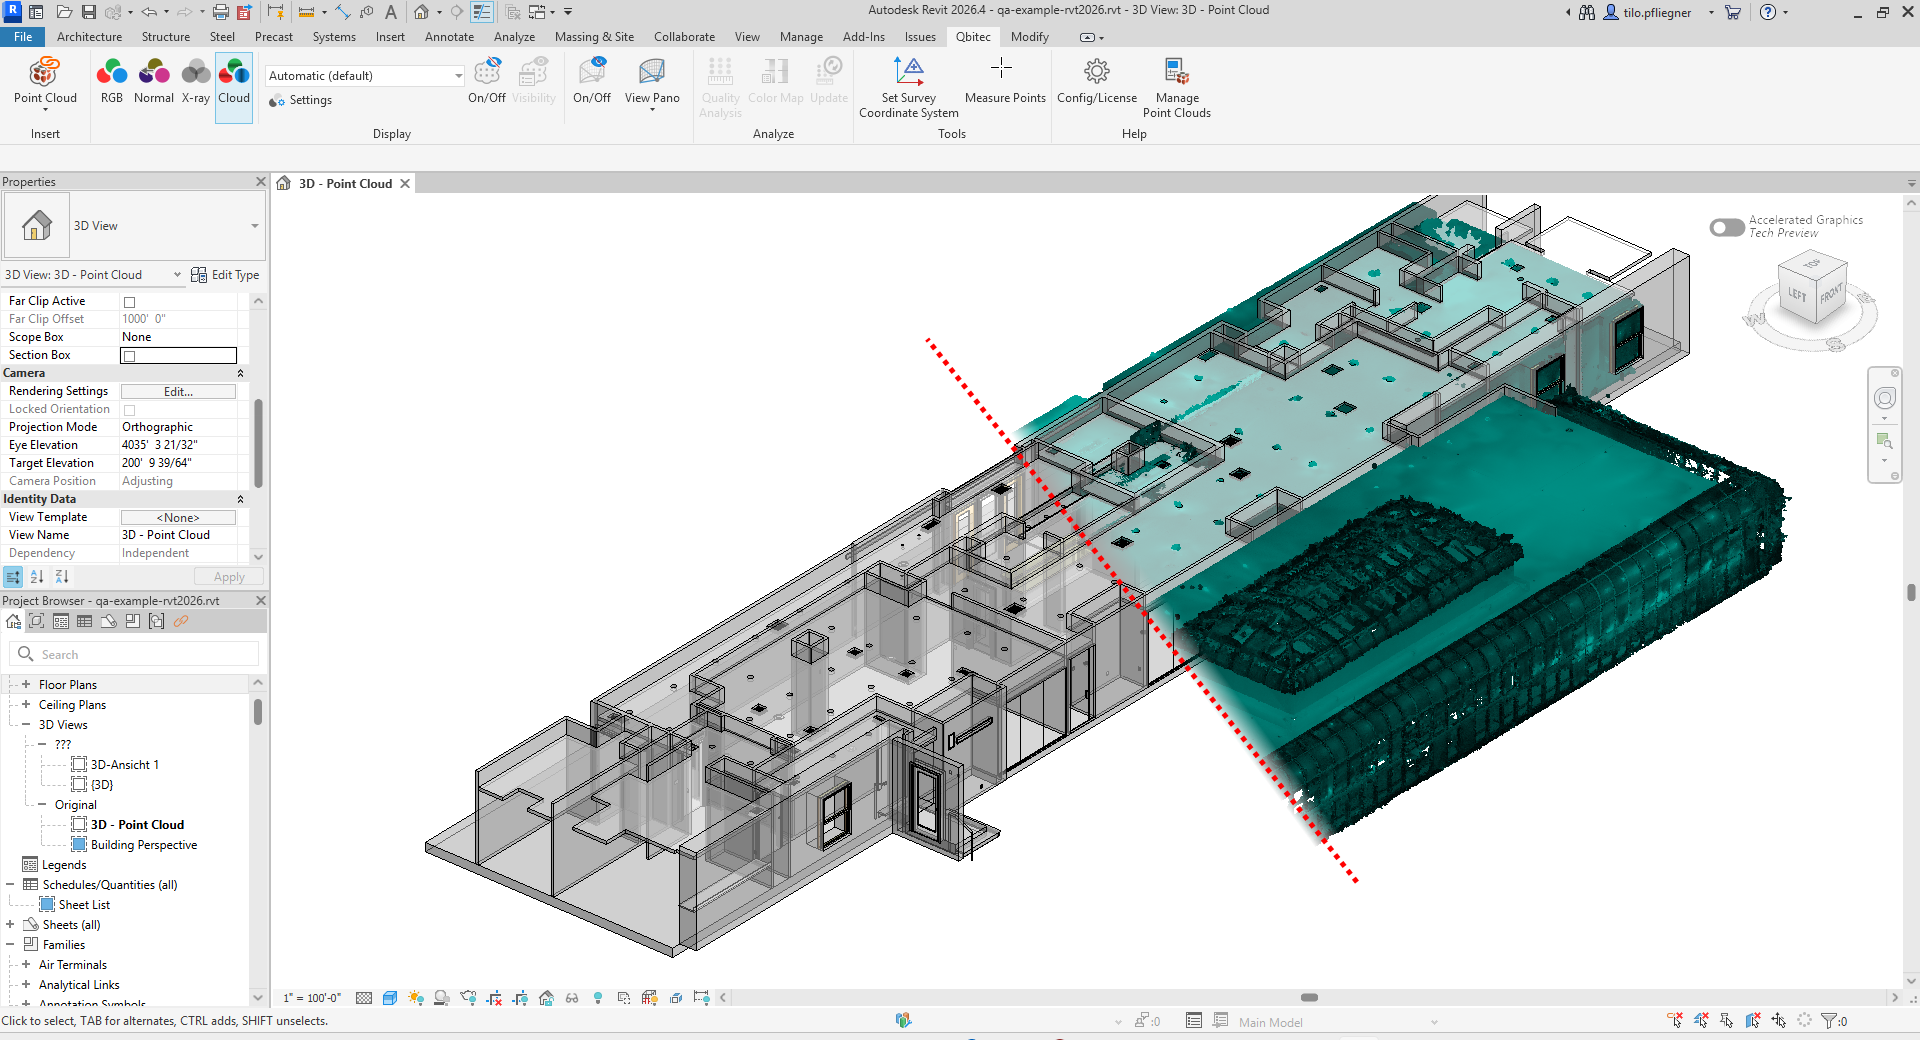
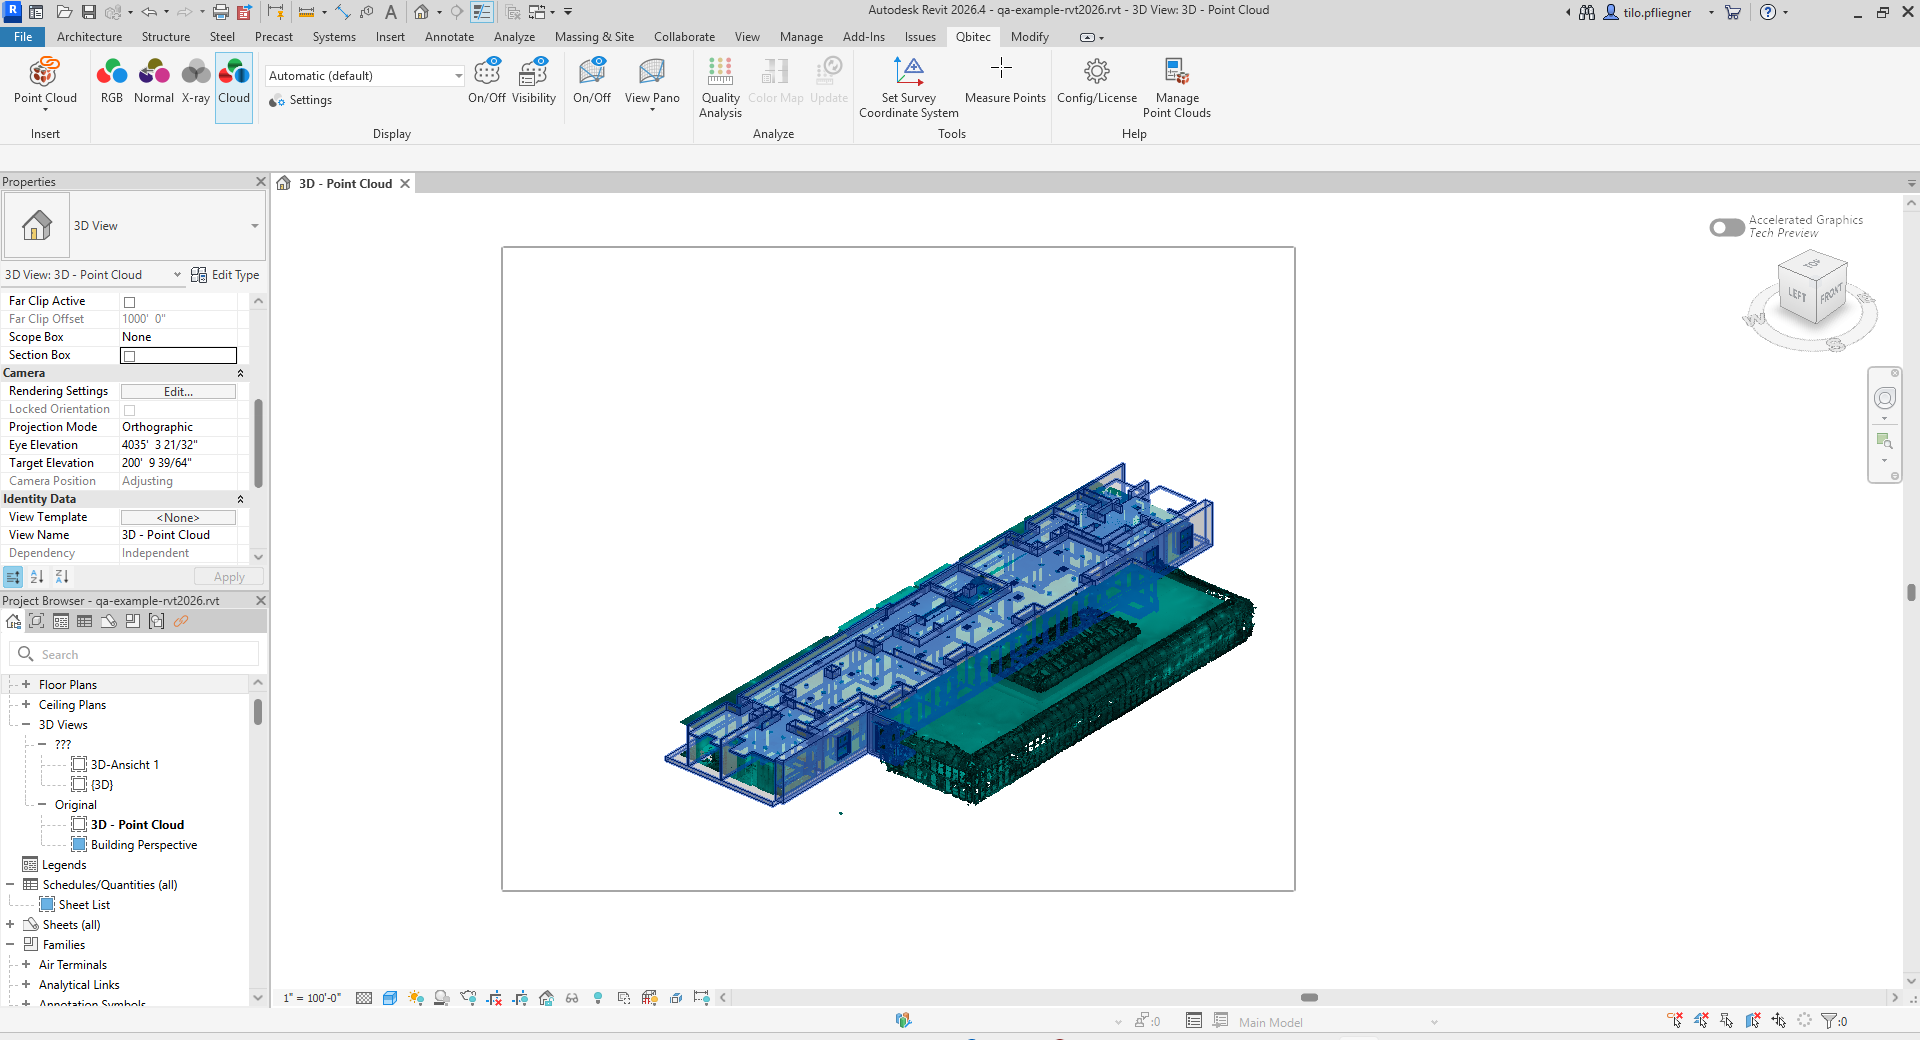
SelectFirst, select all the visible Revit geometryelements in the view:3D view by dragging a selection window over them:
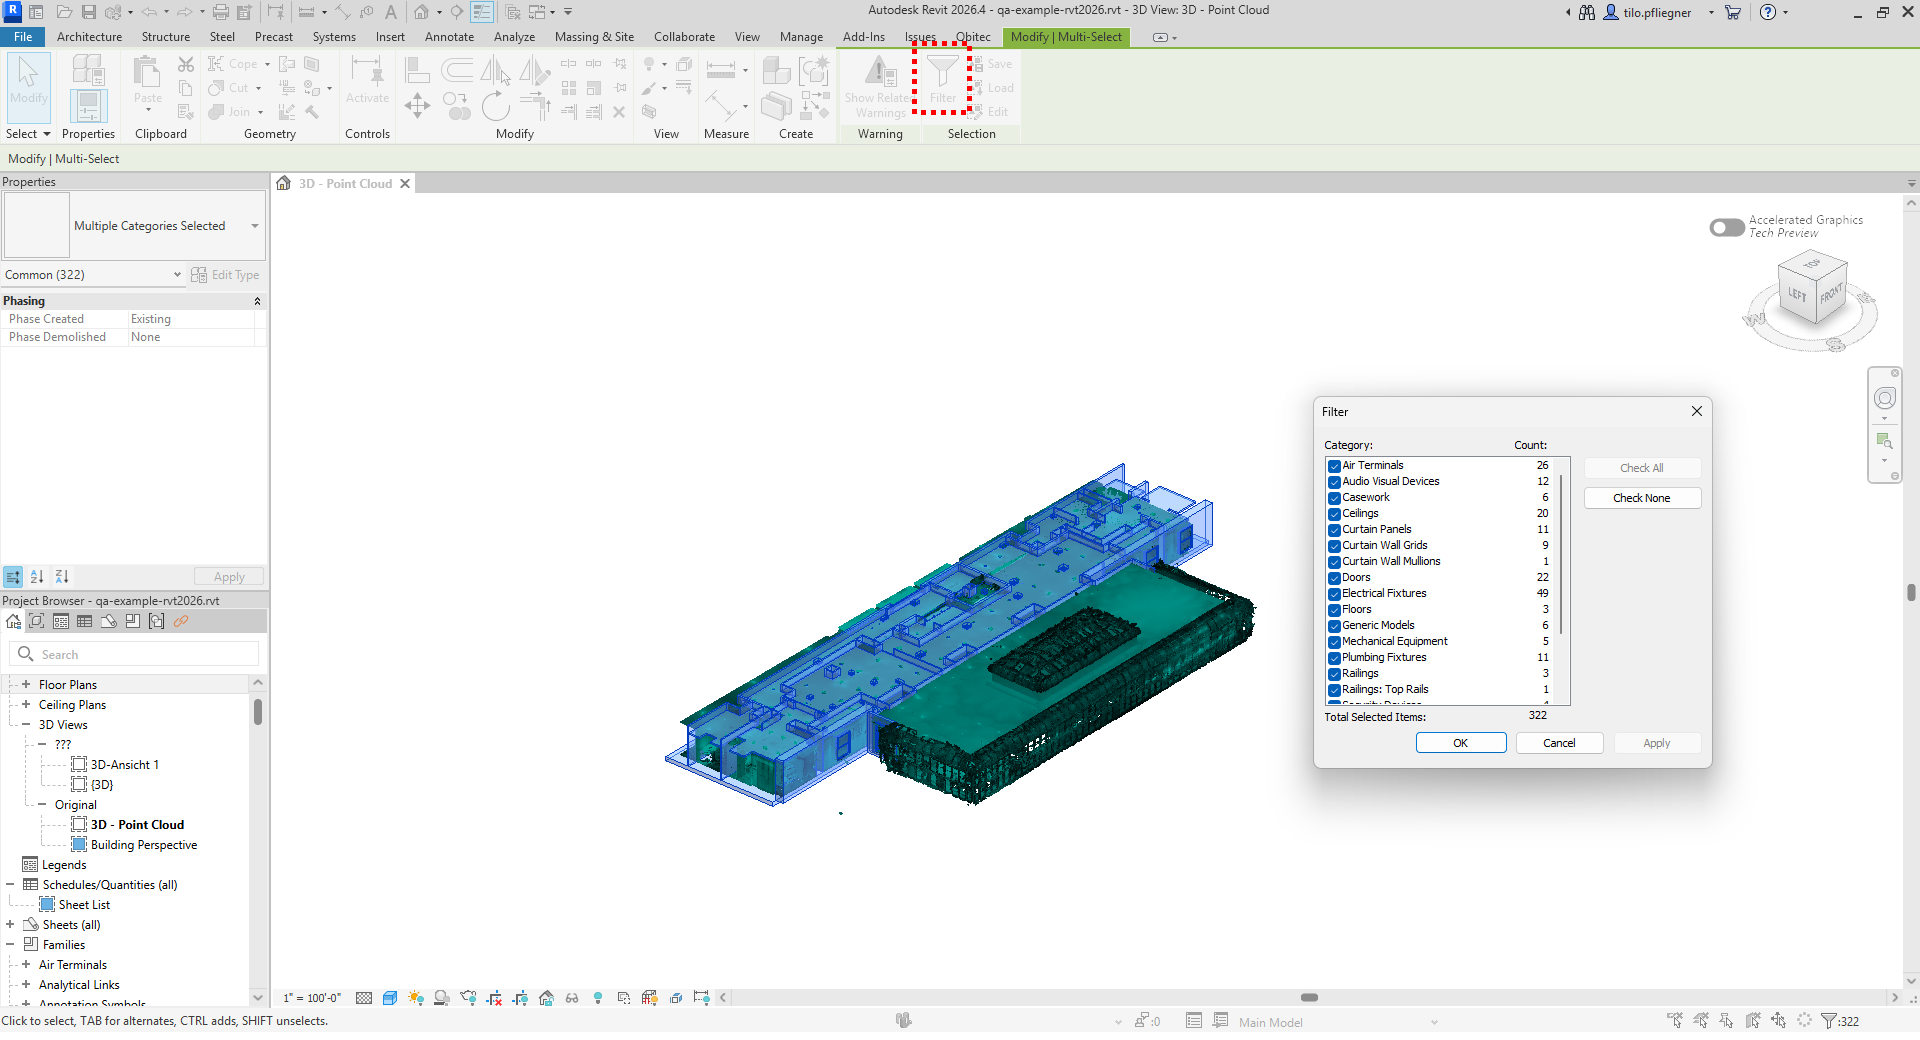
Optionally,You can now optionally use Revit's Selection Filter to filtersearch for certainspecific element types:categories, if you wish. For now, we will leave all categories selected:
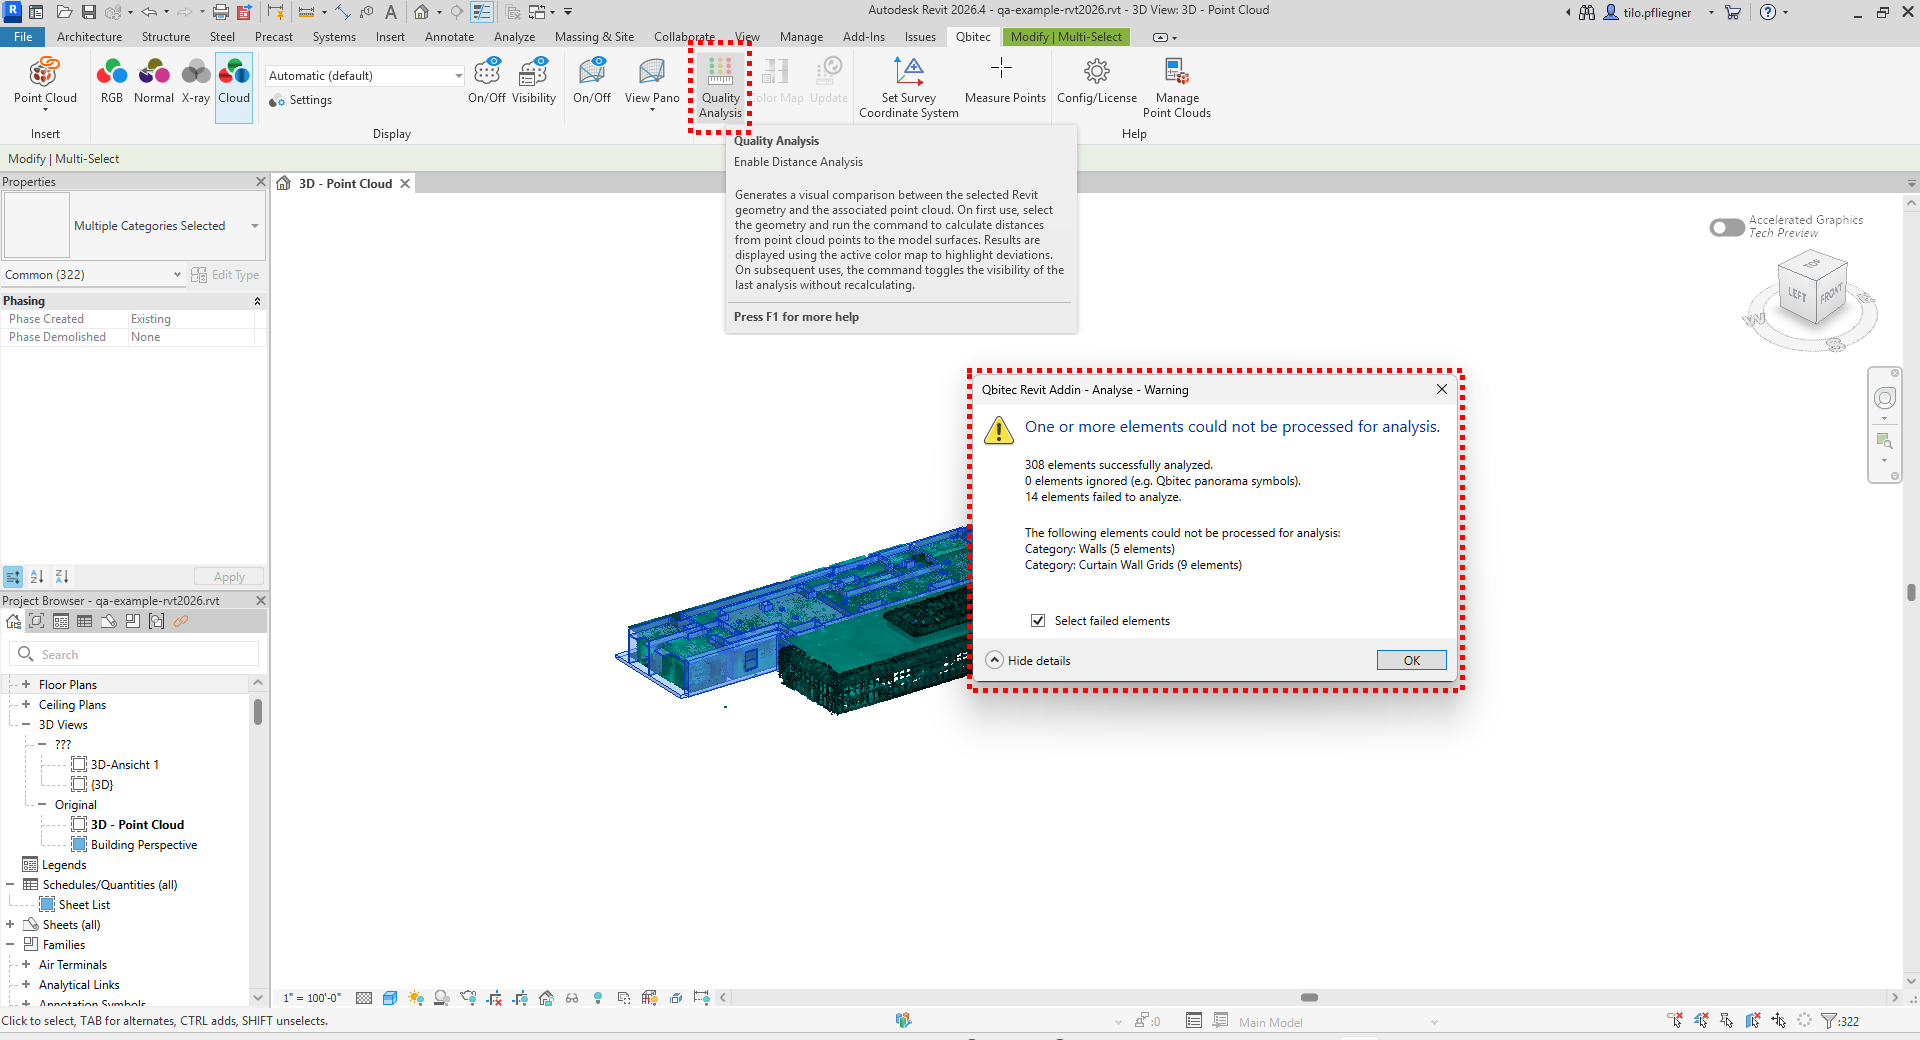
ClickIn the Qbitec Ribbon click the Quality Analysis button. The geometry of the selected elements will be processed.extracted. SomeThat might take up to a couple of seconds, depending on the amount of elements mightselected.
In some cases, certain elements may not provide usable geometry and therefore cannot be suitableanalyzed. In this case, a message will appear listing the successful, ignored, and failed elements. Additionally, the failed elements can be selected for analysis.further Thisreview. isQbitec thefamily casesymbols, Ifsuch thereas panoramic images or measurement symbols, are elementsignored thatby don't provide produce any analyzable geometry
default:
Theconfirming, the plugincalculatesnow starts calculating the shortest distance from every point cloud point to all the selectedgeometry.Distances are displayed using the active Color Map.Switch or edit color maps via theColor Mapcommand to suit your analysis case.If geometry changes or you want to analyze a different selection, pick the new elements and press theUpdatebutton to recalculate.Toggle the visualization on or off anytime with theQuality Analysisbutton.
After
Note: Distances are calculated dynamically. The analysis starts at a coarse level so results become visible quickly, and then refines to deeper levels to reveal finer details. EachFor each point cloudin the point iscloud, mappedthe to its closestshortest distance fromto the selected Revit geometry andis visualized based on the selected color map. A set of pre-defined color maps suitable for all use cases will be created, using the chosenfirst one ("rainbow", Flatness check) as a default:
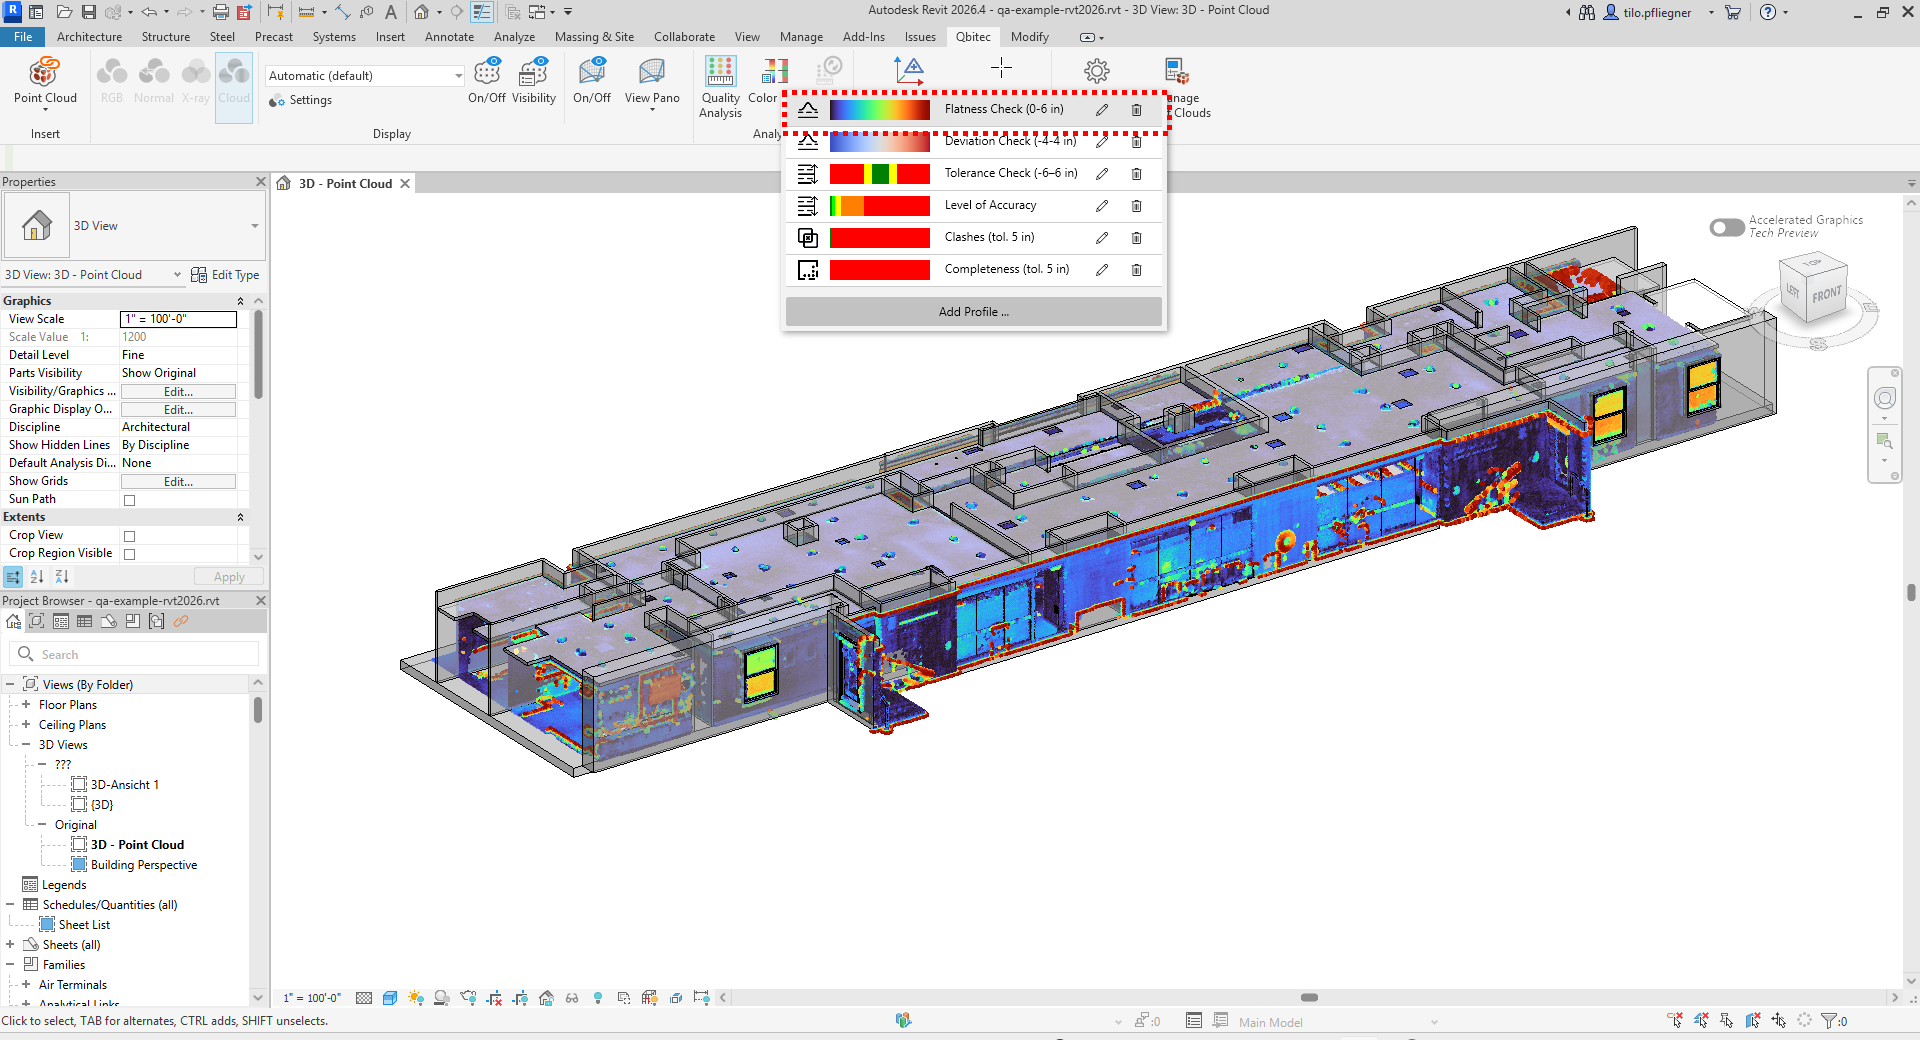
You can now switch between the different color map.maps and application scenarios, customize the color maps as you like, or add new ones. The color palettes are saved in the Revit project and are therefore available and ready to use at any time.
Toggle the visualization on or off anytime with the Quality Analysis button. When the quality analysis is reactivated, the geometry of the previously selected elements will be reused. If geometry changes or you want to analyze a different selection, pick the new elements and press the Update button to recalculate.
Note that the calculated distances and geometry used for quality analysis are not saved with the project and will be recalculated when the project is reopened.