Showing and Exporting Legends
Legends provide explanations of the currently active color map. For continuous color maps (as used by the deviation analysis) they show the entire map together with their respective values at equal distances. For discrete color maps (as used in the tolerance check) they show the different intervals.
To access the legend click the "Legend" button in the "Analyze" section of the Qbitec ribbon.

This will open a side panel that shows the color map legend.
Continuous color maps
Continuous color maps, i.e. color maps with smoothly interpolated colors, display as a vertical bar, together with a representative set of values at equidistant intervals.
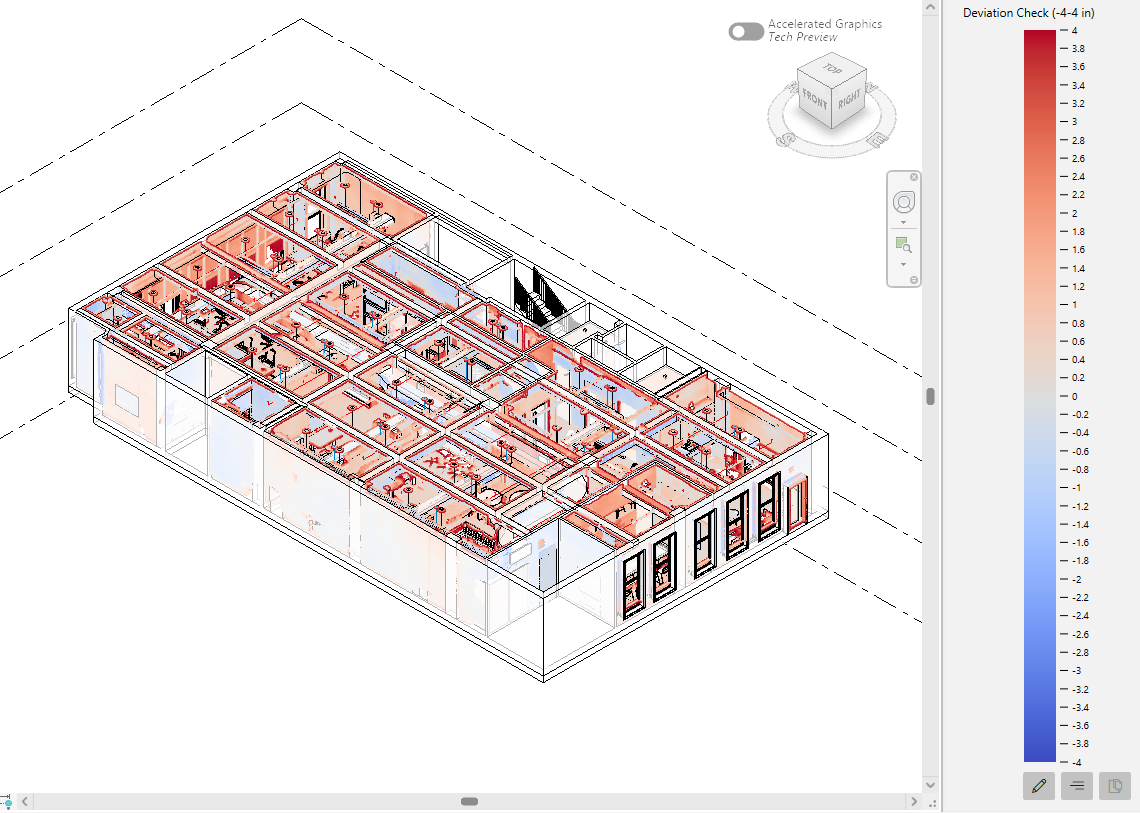
The distance between the different labels is automatically determined depending on the height of the dock to provide a compromise between information density and readability.
Discrete color maps
Discrete color maps, i.e. color maps that consist of intervals of a uniform color are displayed as a set of boxes, each describing one interval.
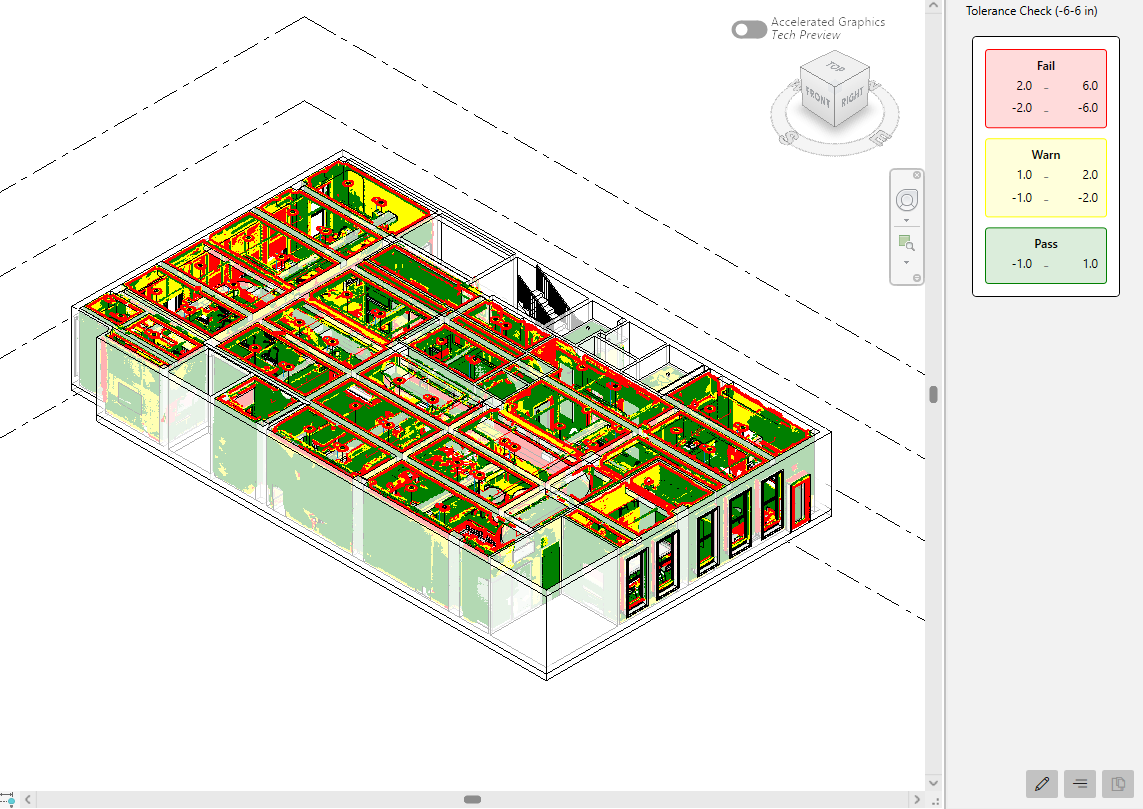
Each box contains the following information
- Background color: indicates the color of the interval in the QC rendering.
- Name: defines the semantics of the block, i.e. "Fail" or "Warn", or in case of custom color maps user-defined names.
- Ranges: defines the intervals for the color maps. In the case of color maps with signed distances, two ranges are provided.
For example, the color map in the image above consists of three intervals "Fail", "Warn" and "Pass". "Fail" ranges from 1 to 6 inch, or from -2 to -6 inch. Warn ranges from 1 to 2 inch or -1 to -2 inch and "Pass" goes from -1 to +1 inch.
Exporting Color Legends
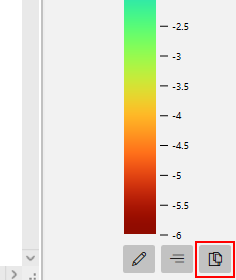
Color legends can be exported by placing them on a sheet. When a view with an active QC view is placed on a sheet the button to place the legend on the sheet becomes available in the legend side panel.
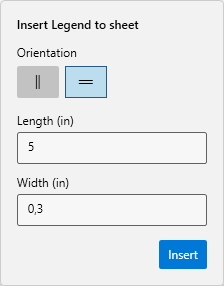
The options are:
- Orientation: whether to insert a vertical or horizontal color legend.
- Length (in sheet units): the total length of the legend. In case of a vertical legend, this defines the height, for a horizontal legend the width is defined.
- Width: the thickness of the legend. Smaller values create slimmer color legends.
The ticks on the inserted color legend is automatically determined based on the length.
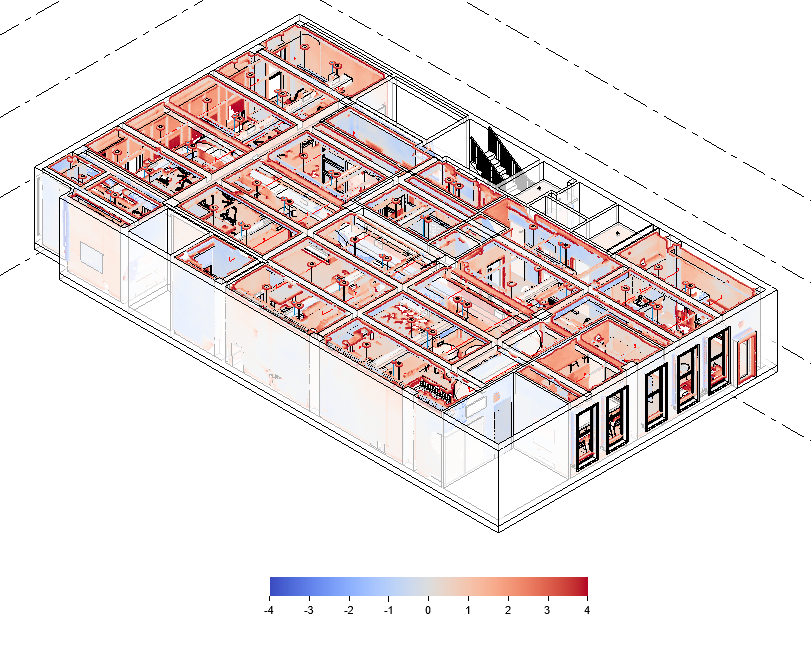
Clicking "Insert" will insert the defined color map on the sheet as a group element consisting of the color map and several text labels. Similar to the side panel, continuous color maps will be shown as a bar graph
And discrete color maps will be shown as boxes for the individual intervals.
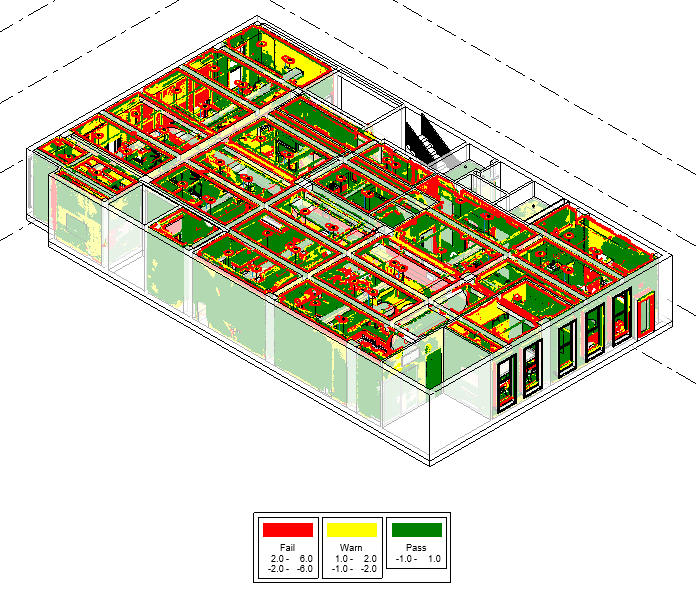
The color map is placed directly below or to the right of the view it belongs to.
Adjusting the text label style
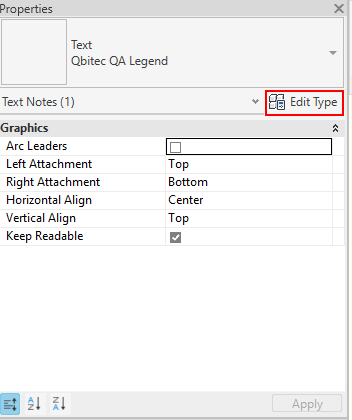
The text labels for continuous color tables are instances of a text label family called "Qbitec QA Legend" that is automatically added to the project once a color map is placed on a sheet. To change the text properties of all labels at once, insert a legend to a sheet, double click the legend to edit the group's content, then select one of the text labels and edit the family type in Revit's properties window.
Working with multiple QC views
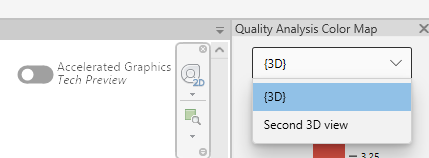
A single sheet can contain multiple 3D views and more than one of them can have a QC render mode enabled. In this case the legend side dock shows a selection box at the very top, allowing you to switch between the active QC views on the sheet. To insert a color map for a specific view, first select this view from the selection box, then follow the steps mentioned above.