Statistical Analyses and Histograms
Based on the current selection and the current color map you can run statistical analyses and generate histograms that can either be shown in the color legend side panel or exported to a sheet.
Depending on the type of color map, different histograms and statistical analyses are provided.
To compute a histogram:
- Select the geometry you want to compare against your point cloud
- Enable the QC visualization by clicking "Quality Analysis" in the "Analyze" section of the Qbitec tab
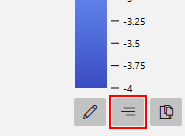
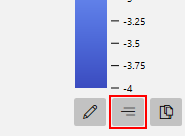
- Click the button "Legend" to reveal the legend side panel
- Compute the histogram or the statistical summary by clicking the "Compute Histogram" button in the lower part of the dock.
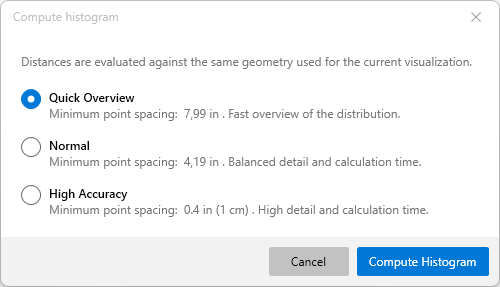
A window opens which allows you to set the granularity of the histogram, i.e. the number of points to consider. The following options are provided:
| Option | Spacing / Reliability | Computation Speed |
| Quick Overview | The lowest spacing that is supported by the point cloud. Good choice for a rough estimate, will not consider detailed parts. | Returns almost immediately |
| Normal | The spacing is computed by taking the center value between the lowest spacing and a spacing of 1 cm (0.4 in). Will produce reliable results and miss very fine details. | Seconds |
| High Accuracy | A spacing of 1 cm (0.4 in) is used. Shoud capture all relevant details. | Seconds to minutes. Will take several minutes for remote point clouds as higher amounts of data might need to be fetched. |
Clicking "Compute Histogram" will start aggregating the values into a histogram and show the current progress. Once computation is complete, the window closes and the histogram is shown in the color legend dock depending on the type of color map.
Histograms for continuous color maps
For continuous color maps, a vertical bar chart is generated next to the color legend to show the distribution along the value range of the color table.
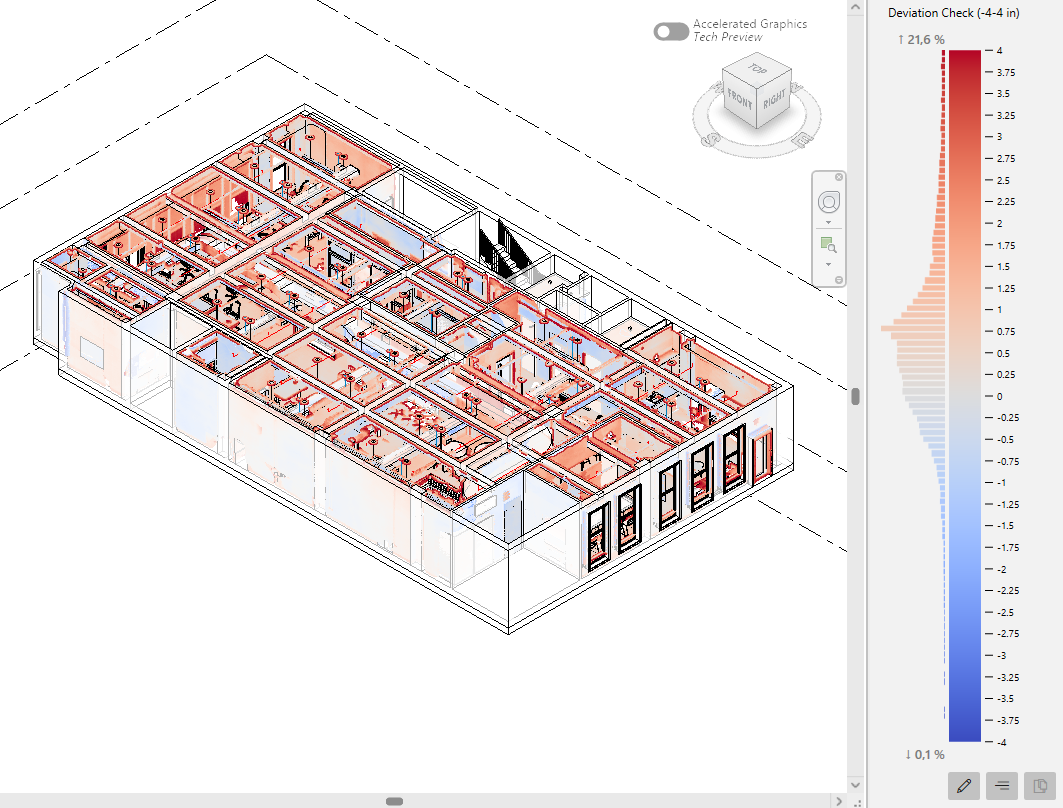
Above and below the histogram percentage values are shown, indicating the percentage of all points that is either above the maximum or below the minimum value. For example, in the image above, 21.6% of all points have a distance greater than 4 inches to the selected geometry and were not considered for the histogram. 0.1% of all points have a distance greater than -4 inches.
Changing the color table invalidates the histogram, i.e. it is not shown next to the color bar and needs to be recomputed.
Histograms for discrete color maps
Discrete color maps, i.e. color maps that consist of intervals of constant colors, show the percentage of points falling into a specific interval. After a histogram has been computed, the individual boxes show progress bars.
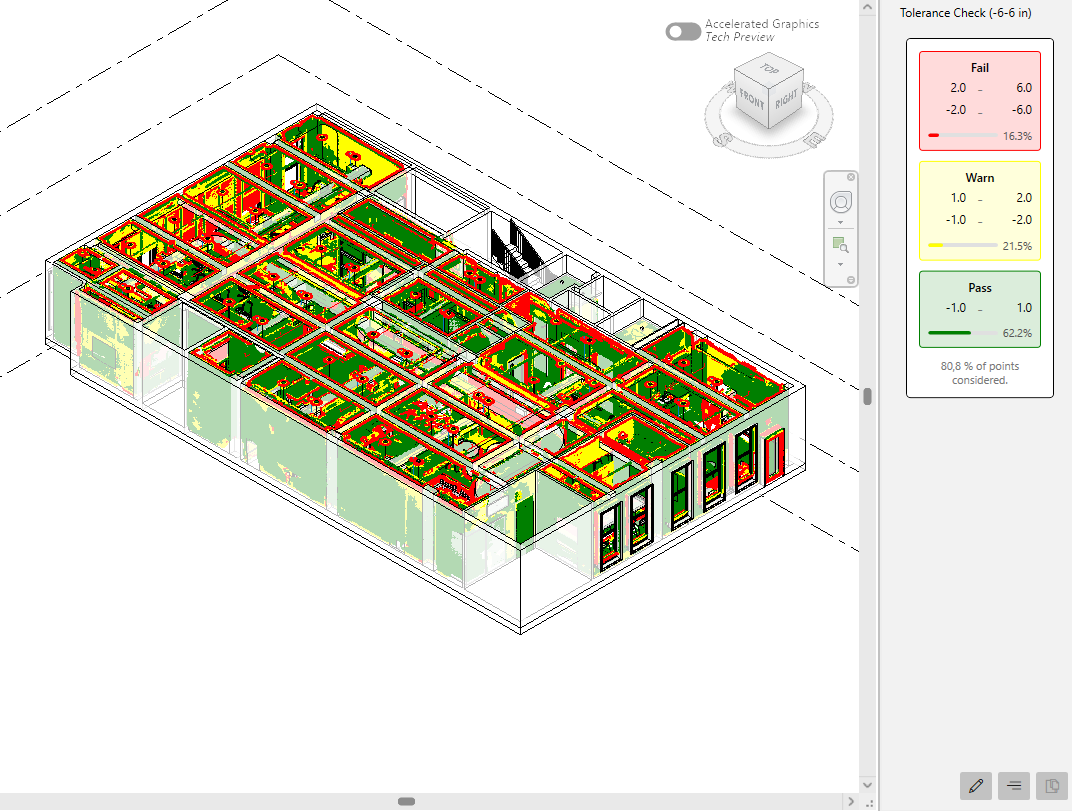
In this example, 16.3% fall into the "Fail" range, 21.5% are in the "Warn" range and 62.2% are inside the "Pass" range. Below the bars, a hint text shows the amount of points considered. In this example 80.8% were considered, that means 19.2% are outside the 3 intervals and were not considered for the statistics.
Charts for Completeness Check
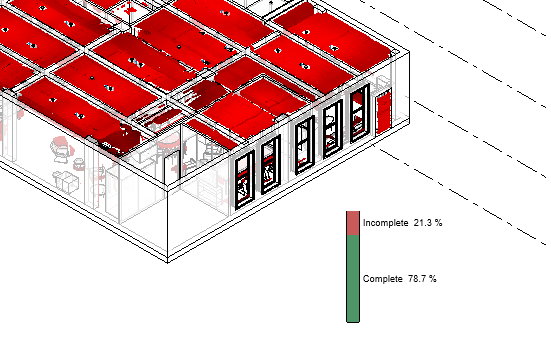
The Completeness Check color map itself does not have a color legend, as it would be trivial. Its space is instead used to show the histogram once computed. It consists of a stacked bar chart visualizing the amount of points that are considered part of a part of a model versus the points that are not associated with any model part and are thus considered to be part of unmodelled parts.
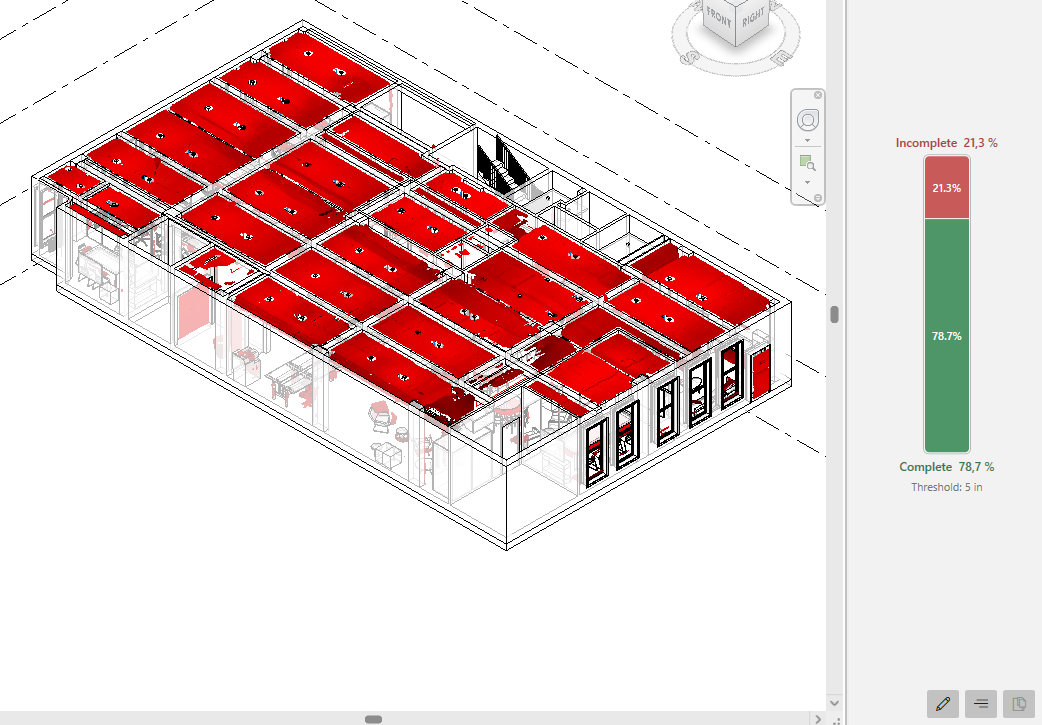
The example above shows that 78.7% of all points could be associated to a model, while 21.3% might represent unmodelled parts, giving a quick overview on the progress of the modelling. The "Threshold" value below the stacked bar graph shows the used threshold, i.e. the minimum distance to the model at which points are not considered to be represented by the model. You can freely define this value in the color map editor.
Charts for Clash Detection
Similar to the completeness check, the clash detection color map does not have a color legend and uses the space to show a stacked bar chart. The chart consists of two elements, which is the number of points that are not considered clashing versus the points that fall below the defined threshold as set in the color map editor.

The example below shows that 78.7% of points are closer than 5 inches to the model and 21.3% of the points are further away. The "Threshold" value below the stacked bar chart shows the threshold, i.e. the maximum distance used to discern between points that are considered clashing and points that are considered clear.
Placing histograms on sheets
Histograms and completeness/clash bar charts can be placed on sheets. To add a histogram compute a histogram as shown above, then place the color legend on a sheet (see the article "Showing an Exporting Legends"). Click the "Insert legend to sheet" button on the color map legend side panel
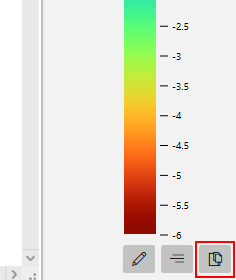
If a histogram is available, it will automatically be placed on the sheet alongside the color legend.
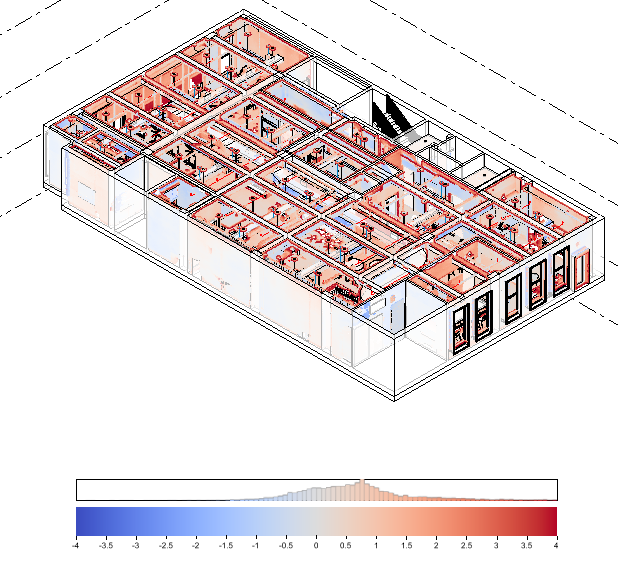
Similar to the side panel, a different type of histogram / statistical analysis will be shown depending on the type of visualization. For example, a completeness check view will show the stacked bar chart.